Vadim Aldzhanov - IT Architecture from A to Z - Theoretical basis. First Edition
Здесь есть возможность читать онлайн «Vadim Aldzhanov - IT Architecture from A to Z - Theoretical basis. First Edition» — ознакомительный отрывок электронной книги совершенно бесплатно, а после прочтения отрывка купить полную версию. В некоторых случаях можно слушать аудио, скачать через торрент в формате fb2 и присутствует краткое содержание. ISBN: , Жанр: Прочая околокомпьтерная литература, на английском языке. Описание произведения, (предисловие) а так же отзывы посетителей доступны на портале библиотеки ЛибКат.

- Название:IT Architecture from A to Z: Theoretical basis. First Edition
- Автор:
- Жанр:
- Год:неизвестен
- ISBN:9785449391322
- Рейтинг книги:5 / 5. Голосов: 1
-
Избранное:Добавить в избранное
- Отзывы:
-
Ваша оценка:
IT Architecture from A to Z: Theoretical basis. First Edition: краткое содержание, описание и аннотация
Предлагаем к чтению аннотацию, описание, краткое содержание или предисловие (зависит от того, что написал сам автор книги «IT Architecture from A to Z: Theoretical basis. First Edition»). Если вы не нашли необходимую информацию о книге — напишите в комментариях, мы постараемся отыскать её.
IT Architecture from A to Z: Theoretical basis. First Edition — читать онлайн ознакомительный отрывок
Ниже представлен текст книги, разбитый по страницам. Система сохранения места последней прочитанной страницы, позволяет с удобством читать онлайн бесплатно книгу «IT Architecture from A to Z: Theoretical basis. First Edition», без необходимости каждый раз заново искать на чём Вы остановились. Поставьте закладку, и сможете в любой момент перейти на страницу, на которой закончили чтение.
Интервал:
Закладка:
The beginning, end, and length of a segment on the time scale correspond to the beginning, end, and duration of the task.
Earned Value Analysis (EVA)
Earned Value Analysis (EVA) is the calculation of project performance indicators within the scope of the acquired volume. EVA is based on the same principles as cost trend analysis and is usually used in large projects. The basis is taken from the figures: The earned value, planned and actual costs. Let’s consider the following example:
The task 1 must be completed by one performer (P1) within two days (2 x 8 hours = 16 hours), the cost of work of the performer is $ 10.00 per hour (planned expenditure = $ 10.00 x 16 hours = $ 160.00).
In fact, the performer finished work on the third day, having spent additional two hours. The indicators are the fact of time (2 x 8 hours +2 hours = 18 hours), while actual expenses = $ 10.00 x 18 hours = $ 180.00.
The result is:
On the morning of the third day the result of the task 1 = 16 / (16 +2) * 100% = 89% and the cost of the Task 1 = $ 180.00
Conclusion: Common sense tells us that we spend money faster than we get the result.
Main method indicators:
Planned Value (PV) is an amount of planned work within basic prices. In our example, PV is equal to $ 160, since the basic amount of work to be completed by Wednesday is 16 person-hours, and the base price is $ 10 per hour.
Earned Value (EV) is a completed part of the work of the planned amount. It is percentage of completion of work, multiplied by the base task budget. This indicator used to be called BCWP (base cost of work performed). In our example, EV is equal to $ 142, since the percentage of the task carried out is equal to 89%, and its base budget is $ 160.
Actual Cost (AC) is a real cost of work performed. It is measured by the amount of money that is actually available for the work performed. In our example, AC is equal to $ 160, because in fact, the performer spent 16 hours, and every hour costs $ 10.
Budget at Completion (BAC) is fixed at the start of the project as the amount of the approved budget for the entire project. In our case, it is equal to $ 160.
Cost Variance (CV) is a value deviation (formula: CV = EV-AC). $142.00 – $160.00 = – $18.00. Negative value means that the budget has been exceeded, while a positive implies that the budget has been saved. In our case, the budget has been overspent.
Schedule Variance (SV) is a time deviation (formula: SV = EV-PV). $142.00 – $160.00 = – $18.00. Negative value means that estimated deadlines are due, while positive one means that the deadlines have been outpaced. We are behind schedule.
Cost Performance Index (CPI) is a cost performance index (formula: CPI = EV / AC). If the index is greater than 1 the budget is saved, if it is less than 1, the budget has been exceeded. In our case, $142.00 / $160.00 = 0.89. The budget over expenditure is 11%.
Schedule Performance Index (SPI) is a deadline index (formula: SPI = EV / PV). If the index is more than 1 the schedule is overtaken, if it is less than 1, the base schedule is outpaced. In our case: SPI = $142.00/$160.00 = 0,89. The schedule is 11% outpaced.
Estimate at Completion (EAC) represents the expected total cost of the project after the completion of the remaining work (Formula: EAC = BAC / CPI). In our case: $160.00 / 0.89 = $180.00. The current estimated cost of the project task is $ 180.00.
Estimate to Complete (ETC) calculates how much more money is required to complete a project (Formula: ETC = EAC-AC). In our case: ETC = EAC-AC = $180.00 – $160.00 = $20.00 are still required to complete the task.
Variance at Completion (VAC) indicates expectations for cost over expenditure or budget savings (formula: VAC = BAC-EAC). In our case: VAC = BAC-EAC = $160.00 – $180.00 = – $20.00. The budget over expenditure is $20.
Formulas for calculating the project status: EAC = AC + Button-up ETC, EAC = AC + BAC – EV, EAC = BAC / Cumulative CPI, EAC = AC + [(BAC – EV) / Cumulative CPI x Cumulative SPI], EMV = probability x impact, EV = BAC /% of completion, TCPI = (BAC – EV) / (BAC – AC).
Cost trend analysis
Cost trend analysis is a method of monitoring a project and the distribution of its costs. It is to align the budget for milestones, the entire project and the timely control of cost increases. Permanently monitored values are:
• Planned costs – what was originally planned for implementation.
• Actual expenses – what was actually spent on the work done.
• The cost of the work done is what was planned and actually spent on the work done. This includes the cost of work, materials, and external services.
• Space remaining is what is left to do and calculated as the difference between the amount of work planned and what was actually made by a certain time. Space remaining = planned costs – the cost of the work done.
• Additional expenses are the difference between actual and planned costs. Additional expenses = actual expenses – planned expenses.
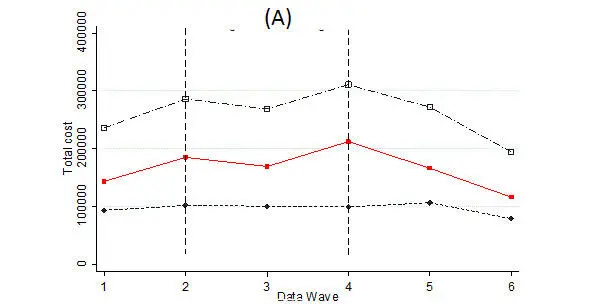
“Cost trend analysis” diagram
V-fact is preliminary actual cost and a signal of overspending. V-fact = budget + additional expenses + space remaining.
Milestone trend analysis
Milestone trend analysis is a method of project monitoring, as well as its backlog or proceeding ahead of schedule. The method allows detecting deviations in the early stages and responding appropriately to improve the situation. The method is based on the analysis of current and planned milestones status. Each milestone has an estimated deadline, which is planned at the project planning stage. This time is the starting point of regular reconciliation. Upon the milestones completion those responsible report to the project manager on the work done. The report should answer the following questions:
• What has been done?
• What should be done to complete the milestone?
• Is the work due?
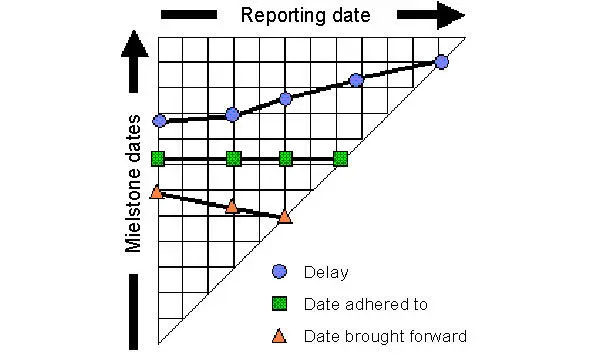
“MILESTONE TREND ANALYSIS” Diagram
The visual trend analysis is often displayed graphically.
Horizontal: reporting periods, for example, every week.
Vertical: the same scale with milestones marked. The milestones mark at X = 0, corresponds to the planned milestone indicators at the stage of project start.
The bisector indicates the position of the milestones reached.
During the reporting period, the chart is updated and analyzed. The chart indicates new forecast dates for milestones completion. Each milestone has a trend line (curve). When it reaches the bisector, it finishes.
The ideal state is when the line is clear and unchanged along the Y axis.
Vertical deviations (deviation of the predicted period from the originally planned):
Up: due deadline
Down: ahead of schedule.
Project Management Triangle
The Three Constraints are:
• Time required carrying out the project;
• Cost (money, people, budget);
• Scope (goals, tasks, quality).
An example of a good project development – The scope of work is met and even exceeded at lower costs and deadlines.
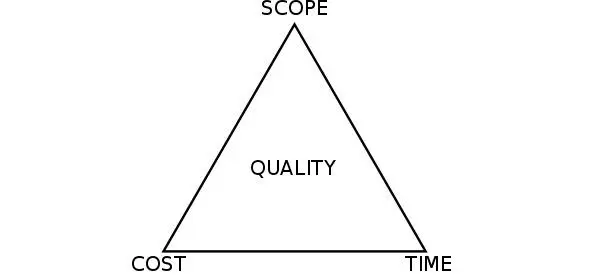
“PROJECT MANAGEMENT TRIANGLE” Diagram
Читать дальшеИнтервал:
Закладка:
Похожие книги на «IT Architecture from A to Z: Theoretical basis. First Edition»
Представляем Вашему вниманию похожие книги на «IT Architecture from A to Z: Theoretical basis. First Edition» списком для выбора. Мы отобрали схожую по названию и смыслу литературу в надежде предоставить читателям больше вариантов отыскать новые, интересные, ещё непрочитанные произведения.


Обсуждение, отзывы о книге «IT Architecture from A to Z: Theoretical basis. First Edition» и просто собственные мнения читателей. Оставьте ваши комментарии, напишите, что Вы думаете о произведении, его смысле или главных героях. Укажите что конкретно понравилось, а что нет, и почему Вы так считаете.