Christopher Hallinan - Embedded Linux Primer - A Practical, Real-World Approach
Здесь есть возможность читать онлайн «Christopher Hallinan - Embedded Linux Primer - A Practical, Real-World Approach» весь текст электронной книги совершенно бесплатно (целиком полную версию без сокращений). В некоторых случаях можно слушать аудио, скачать через торрент в формате fb2 и присутствует краткое содержание. Год выпуска: 2006, ISBN: 2006, Издательство: Prentice Hall, Жанр: ОС и Сети, на английском языке. Описание произведения, (предисловие) а так же отзывы посетителей доступны на портале библиотеки ЛибКат.

- Название:Embedded Linux Primer: A Practical, Real-World Approach
- Автор:
- Издательство:Prentice Hall
- Жанр:
- Год:2006
- ISBN:978-0-13-167984-9
- Рейтинг книги:4 / 5. Голосов: 1
-
Избранное:Добавить в избранное
- Отзывы:
-
Ваша оценка:
Embedded Linux Primer: A Practical, Real-World Approach: краткое содержание, описание и аннотация
Предлагаем к чтению аннотацию, описание, краткое содержание или предисловие (зависит от того, что написал сам автор книги «Embedded Linux Primer: A Practical, Real-World Approach»). Если вы не нашли необходимую информацию о книге — напишите в комментариях, мы постараемся отыскать её.
This book brings together indispensable knowledge for building efficient, high-value, Linux-based embedded products: information that has never been assembled in one place before. Drawing on years of experience as an embedded Linux consultant and field application engineer, Christopher Hallinan offers solutions for the specific technical issues you're most likely to face, demonstrates how to build an effective embedded Linux environment, and shows how to use it as productively as possible.
Hallinan begins by touring a typical Linux-based embedded system, introducing key concepts and components, and calling attention to differences between Linux and traditional embedded environments. Writing from the embedded developer's viewpoint, he thoroughly addresses issues ranging from kernel building and initialization to bootloaders, device drivers to file systems.
Hallinan thoroughly covers the increasingly popular BusyBox utilities; presents a step-by-step walkthrough of porting Linux to custom boards; and introduces real-time configuration via CONFIG_RT--one of today's most exciting developments in embedded Linux. You'll find especially detailed coverage of using development tools to analyze and debug embedded systems--including the art of kernel debugging.
• Compare leading embedded Linux processors
• Understand the details of the Linux kernel initialization process
• Learn about the special role of bootloaders in embedded Linux systems, with specific emphasis on U-Boot
• Use embedded Linux file systems, including JFFS2--with detailed guidelines for building Flash-resident file system images
• Understand the Memory Technology Devices subsystem for flash (and other) memory devices
• Master gdb, KGDB, and hardware JTAG debugging
• Learn many tips and techniques for debugging within the Linux kernel
• Maximize your productivity in cross-development environments
• Prepare your entire development environment, including TFTP, DHCP, and NFS target servers
• Configure, build, and initialize BusyBox to support your unique requirements
Embedded Linux Primer: A Practical, Real-World Approach — читать онлайн бесплатно полную книгу (весь текст) целиком
Ниже представлен текст книги, разбитый по страницам. Система сохранения места последней прочитанной страницы, позволяет с удобством читать онлайн бесплатно книгу «Embedded Linux Primer: A Practical, Real-World Approach», без необходимости каждый раз заново искать на чём Вы остановились. Поставьте закладку, и сможете в любой момент перейти на страницу, на которой закончили чтение.
Интервал:
Закладка:
1244 if (max_loop < 1 || max_loop > 256)
(gdb)
14.3.6. printk Debugging
Debugging kernel and device driver code using printk is a popular technique, mostly because printk has evolved into a very robust method. You can call printk from almost any context, including from interrupt handlers. printk is the kernel's version of the familiar printf() C library function. printk is defined in .../kernel/printk.c.
It is important to understand the limitations of using printk for debugging. First, printk requires a console device. Moreover, although the console device is configured as early as possible during kernel initialization, there are many calls to printk before the console device has been initialized. We present a method to cope with this limitation later, in Section 14.5, "When It Doesn't Boot."
The printk function allows the addition of a string marker that identifies the level of severity of a given message. The header file .../include/linux/kernel.h defines eight levels:
#define KERN_EMERG "<0>" /* system is unusable */
#define KERN_ALERT "<1>" /* action must be taken immediately */
#define KERN_CRIT "<2>" /* critical conditions */
#define KERN_ERR "<3>" /* error conditions */
#define KERN_WARNING "<4>" /* warning conditions */
#define KERN_NOTICE "<5>" /* normal but significant condition */
#define KERN_INFO "<6>" /* informational */
#define KERN_DEBUG "<7>" /* debug-level messages */
A simple printk message might look like this:
printk("foo() entered w/ %s\n", arg);
If the severity string is omitted, the kernel assigns a default severity level, which is defined in printk.c. In recent kernels, this is set at severity level 4, KERN_WARNING. Specifying printk with a severity level might look something like this:
printk(KERN_CRIT "vmalloc failed in foo()\n");
By default, all printk messages below a predefined loglevel are displayed on the system console device. The default loglevel is defined in printk.c. In recent Linux kernels, it has the value 7. This means that any printk message that is greater in importance than KERN_DEBUG will be displayed on the console.
You can set the default kernel loglevel in a variety of ways. At boot time, you can specify the default loglevel on your target board by passing the appropriate kernel command line parameters to the kernel at boot time. Three kernel command line options defined in main.c affect the default loglevel:
• debug Sets the console loglevel to 10
• quiet Sets the console loglevel to 4
• loglevel= Sets the console loglevel to your choice of value
Using debug effectively displays every printk message. Using quiet displays all printk messages of severity KERN_ERR or higher.
printk messages can be logged to files on your target or via the network. Use klogd (kernel log daemon) and syslogd (system log daemon) to control the logging behavior of printk messages. These popular utilities are described in man pages and many Linux references, and are not described here.
14.3.7. Magic SysReq Key
This useful debugging aid is invoked through a series of special predefined key sequences that send messages directly to the kernel. For many target architectures and boards, you use a simple terminal emulator on a serial port as a system console. For these architectures, the Magic SysReq key is defined as a break character followed by a command character. Consult the documentation on the terminal emulator you use for how to send a break character. Many Linux developers use the minicom terminal emulator. For minicom, the break character is sent by typing Ctl-A F. After sending the break in this manner, you have 5 seconds to enter the command character before the command times out.
This useful kernel tool can be very helpful for development and debugging, but it can also cause data loss and system corruption. Indeed, the b command immediately reboots your system without any notification or preparation. Open files are not closed, disks are not synced, and file systems are not unmounted. When the reboot (b) command is issued, control is immediately passed to the reset vector of your architecture in a most abrupt and stunning manner. Use this powerful tool at your own peril!
This feature is well documented in the Linux kernel documentation subdirectory in a file called sysrq.txt. There you find the details for many architectures and the description of available commands.
For example, another way to set the kernel loglevel just discussed is to use the Magic SysReq key. The command is a number from 0 through 9, which results in the default loglevel being set to the number of the command. From minicom, press Ctl-A F followed by a number, such as 9. Here is how it looks on the terminal:
$ SysRq : Changing Loglevel
Loglevel set to 9
Commands can be used to dump registers, shut down your system, reboot your system, dump a list of processes, dump current memory information to your console, and more. See the documentation file in any recent Linux kernel for the details.
This feature is most commonly used when something causes your system to lock up. Often the Magic SysReq key provides a way to learn something from an otherwise dead system.
14.4. Hardware-Assisted Debugging
By now you've probably realized that you cannot debug very early kernel-startup code with KGDB. This is because KGDB is not initialized until after most of the low-level hardware-initialization code has executed. Furthermore, if you are assigned the task of bringing up a brand-new board design and porting a bootloader and the Linux kernel, having a hardware-debug probe is without a doubt the most efficient means of debugging problems in these early stages of board porting.
You can choose from a wide variety of hardware-debug probes. For the examples in this section, we use a unit manufactured by Abatron called the BDI-2000 (see www.abatron.ch). These units are often called JTAG probes because they use a low-level communications method that was first employed for boundary scan testing of integrated circuits defined by the Joint Test Action Group (JTAG).
A JTAG probe contains a small connector designed for connection to your target board. It is often a simple square-pin header and ribbon cable arrangement. Most modern high-performance CPUs contain a JTAG interface that is designed to provide this software debugging capability. The JTAG probe connects to this CPU JTAG interface. The other side of the JTAG probe connects to your host development system usually via Ethernet, USB, or a parallel port. Figure 14-6 details the setup for the Abatron unit.
Figure 14-6. Hardware JTAG probe debugging
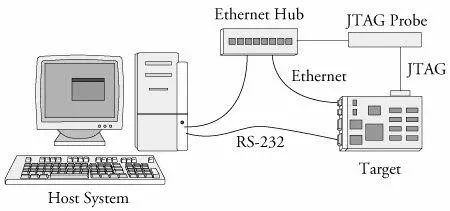
JTAG probes can be complicated to set up. This is a direct result of the complexity of the CPU to which it is connected. When power is applied to a target board and its CPU comes out of reset, almost nothing is initialized. In fact, many processors need at least a small amount of initialization before they can do anything. Many methods are available for getting this initial configuration into the CPU. Some CPUs read a hardware-configuration word or initial values of specific pins to learn their power-on configuration. Others rely on reading a default location in a simple nonvolatile storage device such as Flash. When using a JTAG probe, especially for bringing up a new board design, a minimum level of CPU and board initialization must be performed before anything else can be done. Many JTAG probes rely on a configuration file for this initialization.
Читать дальшеИнтервал:
Закладка:
Похожие книги на «Embedded Linux Primer: A Practical, Real-World Approach»
Представляем Вашему вниманию похожие книги на «Embedded Linux Primer: A Practical, Real-World Approach» списком для выбора. Мы отобрали схожую по названию и смыслу литературу в надежде предоставить читателям больше вариантов отыскать новые, интересные, ещё непрочитанные произведения.


Обсуждение, отзывы о книге «Embedded Linux Primer: A Practical, Real-World Approach» и просто собственные мнения читателей. Оставьте ваши комментарии, напишите, что Вы думаете о произведении, его смысле или главных героях. Укажите что конкретно понравилось, а что нет, и почему Вы так считаете.