Christopher Hallinan - Embedded Linux Primer - A Practical, Real-World Approach
Здесь есть возможность читать онлайн «Christopher Hallinan - Embedded Linux Primer - A Practical, Real-World Approach» весь текст электронной книги совершенно бесплатно (целиком полную версию без сокращений). В некоторых случаях можно слушать аудио, скачать через торрент в формате fb2 и присутствует краткое содержание. Год выпуска: 2006, ISBN: 2006, Издательство: Prentice Hall, Жанр: ОС и Сети, на английском языке. Описание произведения, (предисловие) а так же отзывы посетителей доступны на портале библиотеки ЛибКат.

- Название:Embedded Linux Primer: A Practical, Real-World Approach
- Автор:
- Издательство:Prentice Hall
- Жанр:
- Год:2006
- ISBN:978-0-13-167984-9
- Рейтинг книги:4 / 5. Голосов: 1
-
Избранное:Добавить в избранное
- Отзывы:
-
Ваша оценка:
Embedded Linux Primer: A Practical, Real-World Approach: краткое содержание, описание и аннотация
Предлагаем к чтению аннотацию, описание, краткое содержание или предисловие (зависит от того, что написал сам автор книги «Embedded Linux Primer: A Practical, Real-World Approach»). Если вы не нашли необходимую информацию о книге — напишите в комментариях, мы постараемся отыскать её.
This book brings together indispensable knowledge for building efficient, high-value, Linux-based embedded products: information that has never been assembled in one place before. Drawing on years of experience as an embedded Linux consultant and field application engineer, Christopher Hallinan offers solutions for the specific technical issues you're most likely to face, demonstrates how to build an effective embedded Linux environment, and shows how to use it as productively as possible.
Hallinan begins by touring a typical Linux-based embedded system, introducing key concepts and components, and calling attention to differences between Linux and traditional embedded environments. Writing from the embedded developer's viewpoint, he thoroughly addresses issues ranging from kernel building and initialization to bootloaders, device drivers to file systems.
Hallinan thoroughly covers the increasingly popular BusyBox utilities; presents a step-by-step walkthrough of porting Linux to custom boards; and introduces real-time configuration via CONFIG_RT--one of today's most exciting developments in embedded Linux. You'll find especially detailed coverage of using development tools to analyze and debug embedded systems--including the art of kernel debugging.
• Compare leading embedded Linux processors
• Understand the details of the Linux kernel initialization process
• Learn about the special role of bootloaders in embedded Linux systems, with specific emphasis on U-Boot
• Use embedded Linux file systems, including JFFS2--with detailed guidelines for building Flash-resident file system images
• Understand the Memory Technology Devices subsystem for flash (and other) memory devices
• Master gdb, KGDB, and hardware JTAG debugging
• Learn many tips and techniques for debugging within the Linux kernel
• Maximize your productivity in cross-development environments
• Prepare your entire development environment, including TFTP, DHCP, and NFS target servers
• Configure, build, and initialize BusyBox to support your unique requirements
Embedded Linux Primer: A Practical, Real-World Approach — читать онлайн бесплатно полную книгу (весь текст) целиком
Ниже представлен текст книги, разбитый по страницам. Система сохранения места последней прочитанной страницы, позволяет с удобством читать онлайн бесплатно книгу «Embedded Linux Primer: A Practical, Real-World Approach», без необходимости каждый раз заново искать на чём Вы остановились. Поставьте закладку, и сможете в любой момент перейти на страницу, на которой закончили чтение.
Интервал:
Закладка:
Lines 14 through 39 decode and display the state of the process. This is followed by displaying the user process next instruction pointer (NIP) and the kernel stack pointer (SP). Finally, the device associated with the process is displayed, followed by the name of the process (stored in the ->comm element of the task_struct .)
It is important to note that this macro is architecture dependent, as shown in lines 7 and 8. In general, macros such as these are highly architecture- and version-dependent. Any time a change in the underlying structure is made, macros such as these must be updated. However, if you spend a lot of time debugging the kernel using gdb, the payback is often worth the effort.
For completeness, we present the find_next_task macro. Its implementation is less than obvious and deserves explanation. (It is assumed that you can easily deduce the task_struct_header that completes the series necessary for the ps macro presented in this section. It is nothing more than a single line arranging the column headers with the correct amount of whitespace.) Listing 14-15 presents the find_next_task macro used in our ps and find_task macros.
Listing 14-15. gdb find_next_task Macro
define find_next_task
# Given a task address, find the next task in the linked list
set $t = (struct task_struct *)$arg0
set $offset=((char *)&$t->tasks - (char *)$t)
set $t=(struct task_struct *)((char *)$t->tasks.next- (char *)$offset)
end
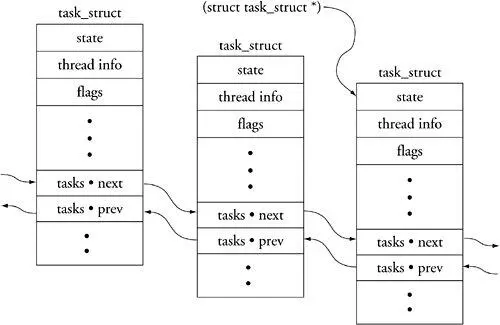
The function performed by this macro is simple. The implementation is slightly less than straightforward. The goal is to return the ->next pointer, which points to the next task_struct on the linked list. However, the task_struct structures are linked by the address of the struct list_head member called tasks, as opposed to the common practice of being linked by the starting address of the task_struct itself. Because the ->next pointer points to the address of the task structure element in the next task_struct on the list, we must subtract to get the address of the top of the task_struct itself. The value we subtract from the ->next pointer is the offset from that pointer's address to the top of task_struct. First we calculate the offset and then we use that offset to adjust the ->next pointer to point to the top of task_struct. Figure 14-5 should make this clear.
Figure 14-5. Task structure list linking
Now we present one final macro that will be useful in the next section when we discuss debugging loadable modules. Listing 14-16 is a simple macro that displays the kernel's list of currently installed loadable modules.
Listing 14-16. gdb List Modules Macro
1 define lsmod
2 printf "Address\t\tModule\n"
3 set $m=(struct list_head *)&modules
4 set $done=0
5 while (!$done)
6 # list_head is 4-bytes into struct module
7 set $mp=(struct module *)((char *)$m->next - (char *)4)
8 printf "0x%08X\t%s\n", $mp, $mp->name
9 if ($mp->list->next == &modules)
10 set $done=1
11 end
12 set $m=$m->next
13 end
14 end
15
16 document lsmod
17 List the loaded kernel modules and their start addresses
18 end
This simple loop starts with the kernel's global variable module. This variable is a struct list_head that marks the start of the linked list of loadable modules. The only complexity is the same as that described in Listing 14-15. We must subtract an offset from the struct list_head pointer to point to the top of the struct module. This is performed in line 7. This macro produces a simple listing of modules containing the address of the struct module and the module's name. Here is an example of its use:
(gdb) lsmod
Address Module
0xD1012A80 ip_conntrack_tftp
0xD10105A0 ip_conntrack
0xD102F9A0 loop
(gdb) help lsmod
List the loaded kernel modules and their start addresses
(gdb)
Macros such as the ones presented here are very powerful debugging aids. You can create macros in a similar fashion to display anything in the kernel that lends itself to easy access, especially the major data structures maintained as linked lists. Examples include process memory map information, module information, file system information, and timer lists and so on. The information presented here should get you started.
14.3.5. Debugging Loadable Modules
The most common reason for using KGDB is to debug loadable kernel modules, that is, device drivers. One of the more convenient features of loadable modules is that, under most circumstances, it is not necessary to reboot the kernel for each new debugging session. You can start a debugging session, make some changes, recompile, and reload the module without the hassle and delay of a complete kernel reboot.
The complication associated with debugging loadable modules is in gaining access to the symbolic debug information contained in the module's object file. Because loadable modules are dynamically linked when they are loaded into the kernel, the symbolic information contained in the object file is useless until the symbol table is adjusted.
Recall from our earlier examples how we invoke gdb for a kernel debugging session:
$ ppc_4xx-gdb vmlinux
This launches a gdb debugging session on your host, and reads the symbol information from the Linux kernel ELF file vmlinux. Of course, you will not find symbols for any loadable modules in this file. Loadable modules are separate compilation units and are linked as individual standalone ELF objects. Therefore, if we intend to perform any source-level debugging on a loadable module, we need to load its debug symbols from the ELF file. gdb provides this capability in its add-symbol-file command.
The add-symbol-file command loads symbols from the specified object file, assuming that the module itself has already been loaded. However, we are faced with the chicken-and-egg syndrome. We don't have any symbol information until the loadable module has been loaded into the kernel and the add-symbol-file command is issued to read in the module's symbol information. However, after the module has been loaded, it is too late to set breakpoints and debug the module's *_init and related functions because they have already executed.
The solution to this dilemma is to place a breakpoint in the kernel code that is responsible for loading the module, after it has been linked but before its initialization function has been called. This work is done by .../kernel/module.c. Listing 14-17 reproduces the relevant portions of module.c.
Listing 14-17. module.c : Module Initialization
...
1901 down(¬ify_mutex);
1902 notifier_call_chain(&module_notify_list, MODULE_STATE_COMING, mod);
1903 up(¬ify_mutex);
1904
1905 /* Start the module */
1906 if (mod->init != NULL)
1907 ret = mod->init();
1908 if (ret < 0) {
1909 /* Init routine failed: abort. Try to protect us from
Интервал:
Закладка:
Похожие книги на «Embedded Linux Primer: A Practical, Real-World Approach»
Представляем Вашему вниманию похожие книги на «Embedded Linux Primer: A Practical, Real-World Approach» списком для выбора. Мы отобрали схожую по названию и смыслу литературу в надежде предоставить читателям больше вариантов отыскать новые, интересные, ещё непрочитанные произведения.


Обсуждение, отзывы о книге «Embedded Linux Primer: A Practical, Real-World Approach» и просто собственные мнения читателей. Оставьте ваши комментарии, напишите, что Вы думаете о произведении, его смысле или главных героях. Укажите что конкретно понравилось, а что нет, и почему Вы так считаете.