Arthur Clarke - The Ghost from the Grand Banks
Здесь есть возможность читать онлайн «Arthur Clarke - The Ghost from the Grand Banks» весь текст электронной книги совершенно бесплатно (целиком полную версию без сокращений). В некоторых случаях можно слушать аудио, скачать через торрент в формате fb2 и присутствует краткое содержание. Город: London, Год выпуска: 1990, ISBN: 1990, Издательство: Gollancz, Жанр: Фантастика и фэнтези, на английском языке. Описание произведения, (предисловие) а так же отзывы посетителей доступны на портале библиотеки ЛибКат.
- Название:The Ghost from the Grand Banks
- Автор:
- Издательство:Gollancz
- Жанр:
- Год:1990
- Город:London
- ISBN:0-575-04906-5
- Рейтинг книги:5 / 5. Голосов: 1
-
Избранное:Добавить в избранное
- Отзывы:
-
Ваша оценка:
The Ghost from the Grand Banks: краткое содержание, описание и аннотация
Предлагаем к чтению аннотацию, описание, краткое содержание или предисловие (зависит от того, что написал сам автор книги «The Ghost from the Grand Banks»). Если вы не нашли необходимую информацию о книге — напишите в комментариях, мы постараемся отыскать её.
The Ghost from the Grand Banks — читать онлайн бесплатно полную книгу (весь текст) целиком
Ниже представлен текст книги, разбитый по страницам. Система сохранения места последней прочитанной страницы, позволяет с удобством читать онлайн бесплатно книгу «The Ghost from the Grand Banks», без необходимости каждый раз заново искать на чём Вы остановились. Поставьте закладку, и сможете в любой момент перейти на страницу, на которой закончили чтение.
Интервал:
Закладка:
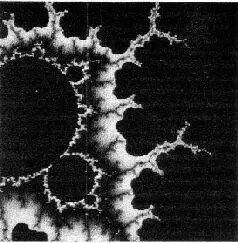
APPENDIX: THE COLORS OF INFINITY
In November 1989, when receiving the Association of Space Explorers Special Achievement Award in Riyadh, Saudi Arabia, I had the privilege of addressing the largest gathering of astronauts and cosmonauts ever assembled at one place. (More than fifty, including Apollo 11’s Buzz Aldrin and Mike Collins, and the first “space walker” Alexei Leonov, who is no longer embarrassed at sharing the dedication of 2010: Odyssey Two with Andrei Sakharov.) I decided to expand their horizons by introducing them to something really large, and, with astronaut Prince Sultan bin Salman bin Abdul Aziz in the chair, delivered a lavishly illustrated lecture “The Colors of Infinity: Exploring the Fractal Universe.”
The material that follows is extracted from my speech; another portion appears at the beginning of Chapter 15. I’m only sorry that I cannot illustrate it with the gorgeous 35-millimeter slides—and videos—I used at Riyadh.
Today, everybody is familiar with graphs—especially the one with time along the horizontal axis, and the cost of living climbing steadily up the vertical one. The idea that any point on a plane can be expressed by two numbers, usually written x and y , now appears so obvious that it seems quite surprising that the world of mathematics had to wait until 1637 for Descartes to invent it.
We are still discovering the consequences of that apparently simple idea, and the most amazing is now just ten years old. It’s called the Mandelbrot Set (from now on, the M-Set) and you’re soon going to meet it everywhere—in the design of fabrics, wallpaper, jewelry, and linoleum. And, I’m afraid, it will be popping out of your TV screen in every other commercial.
Yet the most astonishing feature of the M-Set is its basic simplicity. Unlike almost everything else in modern mathematics, any schoolchild can understand how it is produced. Its generation involves nothing more advanced than addition and multiplication; there’s no need for such complexities as subtraction and—heaven forbid!—division, let alone any of the more exotic beasts from the mathematical menagerie.
There can be few people in the civilized world who have not encountered Einstein’s famous E = mc 2 , or who would consider it too hopelessly complicated to understand. Well, the equation that defines the M-Set contains the same number of terms, and indeed looks very similar. Here it is.
Z = z 2+ c
Not very terrifying, is it? Yet the lifetime of the Universe would not be long enough to explore all its ramifications.
The z ’s and the c in Mandelbrot’s equation are all numbers, not (as in Einstein’s) physical quantities like mass and energy. They are the coordinates which specify the position of a point, and the equation controls the way in which it moves, to trace out a pattern.
There’s a very simple analog familiar to everyone—those children’s books with blank pages sprinkled with numbers, which when joined up in the right order reveal hidden—and often surprising—pictures. The image on a TV screen is produced by a sophisticated application of the same principle.
In theory, anyone who can add and multiply could plot out the M-Set with pen or pencil on a sheet of squared paper. However, as we’ll see later, there are certain practical difficulties—notably the fact that a human life span is seldom more than a hundred years. So the set is invariably computer-generated, and usually shown on a visual display unit.
Now, there are two ways of locating a point in space. The more common employs some kind of grid reference—west-east, north-south, or on squared graph paper, a horizontal X-axis and a vertical Y-axis. But there’s also the system used in radar, now familiar to most people thanks to countless movies. Here the position of an object is given by (1) its distance from the origin, and (2) its direction, or compass bearing. Incidentally, this is the natural system—the one you use automatically and unconsciously when you play any ball game. Then you’re concerned with distances and angles, with yourself as the origin.
So think of a computer’s VDU as a radar screen, with a single blip on it, whose movements are going to trace out the M-Set. However, before we switch on our radar, I want to make the equation even simpler, to:
Z = z 2
I’ve thrown c away, for the moment, and left only the z ’s. Now let me define them more precisely.
Small z is the initial range of the blip—the distance at which it starts. Big Z is its final distance from the origin. Thus if it was initially 2 units away, by obeying this equation it would promptly hop to a distance of 4.
Nothing to get very excited about, but now comes the modification that makes all the difference:

That double arrow is a two-way traffic sign, indicating that the numbers flow in both directions. This time, we don’t stop at Z = 4; we make that equal to a new z —which promptly gives us a second Z of 16, and so on. In no time we’ve generated the series
256, 65536, 4294967296…
and the spot that started only 2 units from the center is heading toward infinity in giant steps of ever-increasing magnitude.
This process of going around and around a loop is called “iteration.” It’s like a dog chasing its own tail, except that a dog doesn’t get anywhere. But mathematical iteration can take us to some very strange places indeed—as we shall soon discover.
Now we’re ready to turn on our radar. Most displays have range circles at 10, 20… 100 kilometers from the center. We will require only a single circle, at a range of 1. There’s no need to specify any units, as we’re dealing with pure numbers. Make them centimeters or light-years, as you please.
Let’s suppose that the initial position of our blip is anywhere on this circle—the bearing doesn’t matter. So z is 1.
And because 1 squared is still 1, so is Z. And it remains at that value, because no matter how many times you square 1, it always remains exactly 1. The blip may hop around and around the circle, but it always stays on it.
Now consider the case where the initial z is greater than 1. We’ve already seen how rapidly the blip shoots off to infinity if z equals 2—but the same thing will happen sooner or later, even if it’s only a microscopic shade more than 1—say 1.000000000000000000001. Watch:
At the first squaring, Z becomes
1.000000000000000000002
then
1.000000000000000000004
1.000000000000000000008
1.000000000000000000016
1.000000000000000000032
and so on for pages of printout. For all practical purposes, the value is still exactly 1. The blip hasn’t moved visibly outward or inward; it’s still on the circle at range 1.
But those zeros are slowly being whittled away, as the digits march inexorably across from the right. Quite suddenly, something appears in the third, second, first decimal place—and the numbers explode after a very few additional terms, as this example shows:
1.001 1.002 1.004 1.008 1.016 1.032
1.066 1.136 1.292 1.668 2.783 7.745
59.987 3598.467 12948970
167675700000000
28115140000000000000000000000
(Overflow)
There could be a million—a billion—zeros on the right-hand side, and the result would still be the same. Eventually the digits would creep up to the decimal point—and then Z would take off to infinity.
Now let’s look at the other case. Suppose z is a microscopic amount less than 1—say something like
Читать дальшеИнтервал:
Закладка:
Похожие книги на «The Ghost from the Grand Banks»
Представляем Вашему вниманию похожие книги на «The Ghost from the Grand Banks» списком для выбора. Мы отобрали схожую по названию и смыслу литературу в надежде предоставить читателям больше вариантов отыскать новые, интересные, ещё непрочитанные произведения.


Обсуждение, отзывы о книге «The Ghost from the Grand Banks» и просто собственные мнения читателей. Оставьте ваши комментарии, напишите, что Вы думаете о произведении, его смысле или главных героях. Укажите что конкретно понравилось, а что нет, и почему Вы так считаете.