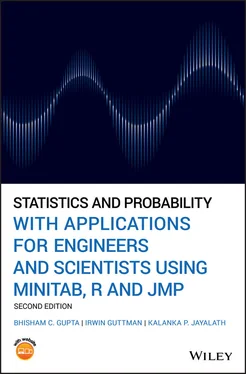
Bhisham C. Gupta - Statistics and Probability with Applications for Engineers and Scientists Using MINITAB, R and JMP
Здесь есть возможность читать онлайн «Bhisham C. Gupta - Statistics and Probability with Applications for Engineers and Scientists Using MINITAB, R and JMP» — ознакомительный отрывок электронной книги совершенно бесплатно, а после прочтения отрывка купить полную версию. В некоторых случаях можно слушать аудио, скачать через торрент в формате fb2 и присутствует краткое содержание. Жанр: unrecognised, на английском языке. Описание произведения, (предисловие) а так же отзывы посетителей доступны на портале библиотеки ЛибКат.
- Название:Statistics and Probability with Applications for Engineers and Scientists Using MINITAB, R and JMP
- Автор:
- Жанр:
- Год:неизвестен
- ISBN:нет данных
- Рейтинг книги:4 / 5. Голосов: 1
-
Избранное:Добавить в избранное
- Отзывы:
-
Ваша оценка:
Statistics and Probability with Applications for Engineers and Scientists Using MINITAB, R and JMP: краткое содержание, описание и аннотация
Предлагаем к чтению аннотацию, описание, краткое содержание или предисловие (зависит от того, что написал сам автор книги «Statistics and Probability with Applications for Engineers and Scientists Using MINITAB, R and JMP»). Если вы не нашли необходимую информацию о книге — напишите в комментариях, мы постараемся отыскать её.
Statistics and Probability with Applications for Engineers and Scientists using MINITAB, R and JMP, Second Edition Features two new chapters—one on Data Mining and another on Cluster Analysis Now contains R exhibits including code, graphical display, and some results MINITAB and JMP have been updated to their latest versions Emphasizes the p-value approach and includes related practical interpretations Offers a more applied statistical focus, and features modified examples to better exhibit statistical concepts Supplemented with an Instructor's-only solutions manual on a book’s companion website
is an excellent text for graduate level data science students, and engineers and scientists. It is also an ideal introduction to applied statistics and probability for undergraduate students in engineering and the natural sciences.
 for selected sample sizes
  and 100...Figure 7.3.1 Graphs of chi‐square density functions for different degrees of f...Figure 7.3.2 Probability density function of the t ‐distribution with
  degrees...Figure 7.3.3 Probability density function of the
  ‐distribution showing 0.025 ...Figure 7.3.4 Probability density functions of
  for various combinations of th...
 and
and  .Figure 8.3.1 (a) Statistical and (b) practical interpretation of a confidence ...Figure 8.5.1 Chi‐square distribution for various degrees of freedom.Figure 8.10.1 An etched silicon wafer.
 in two regions, th...Figure 9.3.1 The critical region for the left‐sided test with
  .Figure 9.3.2 Graphical description of the constituents of Example 9.3.1.Figure 9.3.3 Critical region for the right‐sided test with
  .Figure 9.3.4 Critical region for the two‐sided test with
  .Figure 9.3.5 Power curves for the test in Example 9.3.2.Figure 9.12.1 Decision regions for the sequential test of Example 9.12.1 showi...Figure 9.12.2 Graph of the two‐sided sequential test of hypothesis for
 .Figure 9.13.1 SOIC package.
 ” represents an outlier ...Figure 11.6.1 O‐ring failure challenger data with its logistic regression base...Figure 11.6.2 Classification error probability for various cutoff values.Figure 11.6.3 Receiver operating characteristic (ROC) curve for Example 11.6.2...Figure 11.7.1 A decision tree structure.Figure 11.7.2 (a) Recursive partition of the
  ‐space. (b) Corresponding binary...Figure 11.7.3 Graph of variable C versus Y for data in Table 11.7.1.Figure 11.7.4 Initial tree branches based on Gini index.Figure 11.7.5 Classification tree structure for the Iris data. The vector
  ar...Figure 11.7.6 Regression tree structure for the first 132 observations selecte...Figure 11.7.7 Observed and predicted “time to progression” values for the test...
 and
and  .Figure 12.3.2 Dendrogram for US arrests data for six states based on the singl...Figure 12.3.3 MINITAB dendrogram plot for US crime data for six states based o...Figure 12.3.4 Complete linkage distance between two clusters
  and
and  .Figure 12.3.5 Dendrogram for the US arrests data for six states based on the c...Figure 12.3.6 Average linkage distance between two clusters
  and
and  .Figure 12.3.7 A generated face structure with six different clusters and their...Figure 12.3.8 (a) A generated face structure with six different clusters (b) W...Figure 12.4.1 R output plot of seven two‐dimensional objects. The cluster cent...Figure 12.4.2 MINITAB cluster output plot of seven two‐dimensional objects.Figure 12.5.1 DBSCAN process for two‐dimensional objects.Figure 12.5.2 DBSCAN‐based clustering results for face clustering data.Figure 12.6.1 BIC values for all five covariance structures in Table 12.6.1 fo...Figure 12.6.2 Estimated clusters based on the covariance structures (a) “VEE” ...
 have exactly the s...Figure 15.2.3 Scatter plot of n pairs of measurements
  , on hardness of certai...Figure 15.2.4 Scatter plot for the data in Example 15.2.2.Figure 15.4.3 MINITAB printout of 95% confidence and prediction bands of regre...Figure 15.4.4 R output of 95% confidence and prediction bands of regression li...Figure 15.5.1 Scatter plot for the data in Table 15.5.1.Figure 15.5.3 MINITAB printout of the confidence and prediction bands of regre...Figure 15.7.1 MINITAB plots of the residuals for the data in Example 15.5.2 on...Figure 15.7.2 Some other typical plots in residual analysis, showing departure...Figure 15.7.3 MINITAB scatter plot for the data in Example 15.7.1.Figure 15.7.5 MINITAB residual plots for the data in Example 15.7.1.Figure 15.7.7 MINITAB plots for residual plots for yield and box plot of resid...Figure 15.7.8Figure 15.7.8 MINITAB plot for fitted quadratic: yield versus pho...Figure 15.8.2 MINITAB residual plots: regression analysis of yield versus cata...Figure 15.8.3 Fitted regression lines for (a) yield versus catalyst and (b) ln...Figure 15.8.5 MINITAB residual plots for the regression analysis of ln(yield) ...Figure 15.8.6 R residual plots for the regression analysis of ln(Yield) versus...