Bhisham C. Gupta - Statistics and Probability with Applications for Engineers and Scientists Using MINITAB, R and JMP
Здесь есть возможность читать онлайн «Bhisham C. Gupta - Statistics and Probability with Applications for Engineers and Scientists Using MINITAB, R and JMP» — ознакомительный отрывок электронной книги совершенно бесплатно, а после прочтения отрывка купить полную версию. В некоторых случаях можно слушать аудио, скачать через торрент в формате fb2 и присутствует краткое содержание. Жанр: unrecognised, на английском языке. Описание произведения, (предисловие) а так же отзывы посетителей доступны на портале библиотеки ЛибКат.
- Название:Statistics and Probability with Applications for Engineers and Scientists Using MINITAB, R and JMP
- Автор:
- Жанр:
- Год:неизвестен
- ISBN:нет данных
- Рейтинг книги:4 / 5. Голосов: 1
-
Избранное:Добавить в избранное
- Отзывы:
-
Ваша оценка:
Statistics and Probability with Applications for Engineers and Scientists Using MINITAB, R and JMP: краткое содержание, описание и аннотация
Предлагаем к чтению аннотацию, описание, краткое содержание или предисловие (зависит от того, что написал сам автор книги «Statistics and Probability with Applications for Engineers and Scientists Using MINITAB, R and JMP»). Если вы не нашли необходимую информацию о книге — напишите в комментариях, мы постараемся отыскать её.
Statistics and Probability with Applications for Engineers and Scientists using MINITAB, R and JMP, Second Edition Features two new chapters—one on Data Mining and another on Cluster Analysis Now contains R exhibits including code, graphical display, and some results MINITAB and JMP have been updated to their latest versions Emphasizes the p-value approach and includes related practical interpretations Offers a more applied statistical focus, and features modified examples to better exhibit statistical concepts Supplemented with an Instructor's-only solutions manual on a book’s companion website
is an excellent text for graduate level data science students, and engineers and scientists. It is also an ideal introduction to applied statistics and probability for undergraduate students in engineering and the natural sciences.

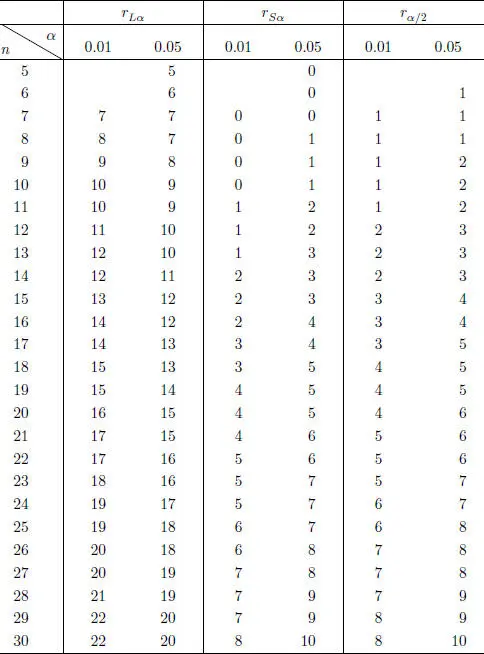
 Critical values of
  when using the sign test. Table 14.2.3 Hemoglobin in rats before and after change in diet.Table 14.2.4 Data and calculations for obtaining the value of the test statistic...Table 14.3.1 Data for Example 14.3.1.Table 14.4.1 Data on rheostats.Table 14.5.1 Interview scores and their ranks.
 ‐levels. Table 17.3.2 ANOVA table for a one‐way experimental layout.Table 17.3.3 Melting point of hydroquinine.Table 17.3.4 Coded data for Example 17.3.1 (
  ). Table 17.3.5
  squared coded observations. Table 17.3.6 ANOVA table for the data in Table 17.3.3.Table 17.3.7 Coded data (
  ) in grams of oil absorbed per batch. Table 17.3.8 Coded data
  in grams of oil absorbed per batch. Table 17.3.9 Coded data (
  ) in grams of oil absorbed per batch and their ranks (...Table 17.4.1 Randomized complete block design layout.Table 17.4.2 ANOVA table for an RCB‐design.Table 17.4.3 Data on 24 patients being treated for high blood pressure.Table 17.4.4 ANOVA table for the data in Table 17.4.3.Table 17.4.5 Octane data for five gasolines.Table 17.4.6 Coded values of parts produced (parts
  400). Table 17.5.1 Responses of two experiments with two factors A and B . Table 17.5.2 Observations from a two‐way experimental layout with one observatio...Table 17.5.3 Observations from a two‐way experimental layout with
  observations ...Table 17.5.4 ANOVA table for a two‐way experimental design ( r observations per c...Table 17.5.5 Percentage (after coding each value by subtracting 10) of defective...Table 17.5.6 ANOVA table for the data in Table 17.5.6.Table 17.5.7 Data on hydroquinine and thermometers.Table 17.5.8 ANOVA table for the data in Table 17.5.7.Table 17.6.1 ANOVA table for an
  Latin square design. Table 17.6.2 Radioactive counting rate data.Table 17.6.3 ANOVA for the data in Example 17.6.1.Table 17.7.1 ANOVA for a two‐way experimental design with random effects.Table 17.7.2 ANOVA table for a two‐way experimental design with mixed effectsTable 17.7.3 ANOVA table for a nested two‐factor experimental design with mixed ...Table 17.7.4 ANOVA table for a nested two‐factor experimental design with random...Table 17.7.6 Percentage of defective parts producedTable 17.7.7 ANOVA table for the data in Table 17.7.6Table 17.7.5
  columns for a nested two‐factor experimental design
 Factorial design in Yates's order in three notations. Table 18.3.2 Treatment matrices for the 2
  and 2
and 2  factorial designs in Yates's o...Table 18.3.3 Design matrix for the 2
  factorial design ( r observations per treat...Table 18.3.4 Data for 2
  factorial in five replicates. Table 18.3.5 ANOVA table for the data in Table 18.3.4.Table 18.3.6 Contrast coefficients for factorial effects.Table 18.3.7 Partitioning the treatment sum of squares into individual degree of...Table 18.3.8 Coefficients of linear and quadratic effect contrasts.Table 18.3.9 Partitioning block sum of squares.Table 18.4.1 Lower and upper levels of various factors.Table 18.4.2 Yield of the chemical and design matrix in two notations.Table 18.4.3 Design matrix and responses.Table 18.4.4 Estimated factorial effects using Table 18.4.3.Table 18.4.5 The 2
  design and observations if dropping B from the design of Tab...Table 18.4.6 Analysis of variance assuming all effects containing B are zero. Table 18.5.1 The plan of the experiment and the data obtained.Table 18.5.2 ANOVA table for the data in Table 18.5.2.Table 18.5.3 Two replications (each replication in two blocks) of a 2
  experimen...Table 18.5.4 Runs of the 2
  and 2
and 2  factorial design in blocks of two treatments ...Table 18.6.1 The full 2
  factorial design and two
  designs obtained by the gene...Table 18.6.2 A
  fractional factorial design. Table 18.6.3 Estimates of effects of the
  fractional factorial design. Table 18.6.4
  fractional factorial design generator − ABCDE with defining relati...Table 18.6.5 Estimates and their ranks.Table 18.6.6 Alias structure for the
  fractional factorial design (generators AB ...Table 18.6.7 The
  fractional factorial design with design generators ABE and CDE Table 18.6.8 Results of an experiment using a
  fractional factorial design to im...Table 18.6.9 ANOVA table of the
  fractional factorial design. Table 18.7.1 Potato crop data.Table 18.7.2 Eddy current probe sensitivity data.


