Bhisham C. Gupta - Statistics and Probability with Applications for Engineers and Scientists Using MINITAB, R and JMP
Здесь есть возможность читать онлайн «Bhisham C. Gupta - Statistics and Probability with Applications for Engineers and Scientists Using MINITAB, R and JMP» — ознакомительный отрывок электронной книги совершенно бесплатно, а после прочтения отрывка купить полную версию. В некоторых случаях можно слушать аудио, скачать через торрент в формате fb2 и присутствует краткое содержание. Жанр: unrecognised, на английском языке. Описание произведения, (предисловие) а так же отзывы посетителей доступны на портале библиотеки ЛибКат.

- Название:Statistics and Probability with Applications for Engineers and Scientists Using MINITAB, R and JMP
- Автор:
- Жанр:
- Год:неизвестен
- ISBN:нет данных
- Рейтинг книги:4 / 5. Голосов: 1
-
Избранное:Добавить в избранное
- Отзывы:
-
Ваша оценка:
Statistics and Probability with Applications for Engineers and Scientists Using MINITAB, R and JMP: краткое содержание, описание и аннотация
Предлагаем к чтению аннотацию, описание, краткое содержание или предисловие (зависит от того, что написал сам автор книги «Statistics and Probability with Applications for Engineers and Scientists Using MINITAB, R and JMP»). Если вы не нашли необходимую информацию о книге — напишите в комментариях, мы постараемся отыскать её.
Statistics and Probability with Applications for Engineers and Scientists using MINITAB, R and JMP, Second Edition Features two new chapters—one on Data Mining and another on Cluster Analysis Now contains R exhibits including code, graphical display, and some results MINITAB and JMP have been updated to their latest versions Emphasizes the p-value approach and includes related practical interpretations Offers a more applied statistical focus, and features modified examples to better exhibit statistical concepts Supplemented with an Instructor's-only solutions manual on a book’s companion website
is an excellent text for graduate level data science students, and engineers and scientists. It is also an ideal introduction to applied statistics and probability for undergraduate students in engineering and the natural sciences.
Statistics and Probability with Applications for Engineers and Scientists Using MINITAB, R and JMP — читать онлайн ознакомительный отрывок
Ниже представлен текст книги, разбитый по страницам. Система сохранения места последней прочитанной страницы, позволяет с удобством читать онлайн бесплатно книгу «Statistics and Probability with Applications for Engineers and Scientists Using MINITAB, R and JMP», без необходимости каждый раз заново искать на чём Вы остановились. Поставьте закладку, и сможете в любой момент перейти на страницу, на которой закончили чтение.
Интервал:
Закладка:

Similarly, if  ,
,  , and
, and  are disjoint, ( 3.3.11) reduces to

PRACTICE PROBLEMS FOR SECTIONS 3.2 AND 3.3
1 Consider a sample space S. Let A and B be any two events in S. Write the expressions in terms of unions, interactions, and complements for the following events:At least one of the events A or B occurs.Both events A and B occur.Neither A nor B occurs.Exactly one of the events A or B occurs.At most one of the events A or B occurs.
2 Draw a Venn diagram for each event described in Problem 1 above.
3 Describe the sample space for each of the following experiments:Three coins are tossed.One die is rolled and a coin is tossed.Two dice are rolled.A family has three children of different ages, and we are interested in recording the gender of these children such that the oldest child is recorded first.One die is rolled and two coins are tossed.
4 Two regular dice are rolled simultaneously. If the numbers showing up are different, what is the probability of getting a total of 10 points?
5 Three students are randomly selected from a freshmen engineering class, and it is observed whether they are majoring in chemical, mechanical, or electrical engineering. Describe the sample space for this experiment. What is the probability that at most one of the three students is an EE major?
6 A box contains a shipment of computer chips, of which four are defective. Four chips are randomly selected and examined as to whether or not the chips are defective. Describe the sample space for this experiment. What is the probability thatExactly one of the four chips is defective?All four chips are defective?Two chips are defective?
7 Given a sample space and four events and in S that are defined as , , , and , describe the following events:(a) , (b) , (c) , (d) , (e) , and (f)
8 Given a sample space and two events A and B in S defined as and , describe the following events:(a) , (b) , (c) (d)
9 Suppose that a person is taken to an ER and that is the event that he is diagnosed with liver cancer, is the event that he will need a liver transplant, and is the event that the hospital will find a matching liver on time. The Venn diagram representing these events and various other regions is shown below. Describe in words the events represented by the following regions:(a) , (b) , (c) (d)
10 In a random experiment four “lock nuts” are selected and each nut is classified either as defective (D) or nondefective (N). Write the sample space for this random experiment.
11 Five women are selected randomly, and their mammograms are examined. Each mammogram is classified as indicating that the woman has breast cancer (C) or does not have breast cancer (N). Write the sample space for this random experiment.
12 The time a biology major takes to dissect a frog is recorded to the nearest minute. Describe the sample space for this random experiment.
13 Three coins are tossed. Describe the following events:At least two heads occur.At most one head occurs.Exactly two heads occur.No head occurs.Find the probability for the occurrence of each event.
14 Two dice are rolled and the sum of the points that appear on the uppermost faces of the two dice is noted. Write all possible outcomes such that:The sum is seven.The sum is five or less.The sum is even or nine.Find the probability for the occurrence of each event you described in parts (a) through (c).
3.4 Techniques of Counting Sample Points
The problem of computing probabilities of events in finite sample spaces where equal probabilities are assigned to the elements reduces to the operation of counting the elements that make up the events in the given sample space. Counting such elements is often greatly simplified by the use of a tree diagram and the rules for permutations and combinations.
3.4.1 Tree Diagram
A tree diagram is a tool that is useful not only in describing the sample points but also in listing them in a systematic way. The following example illustrates this technique.
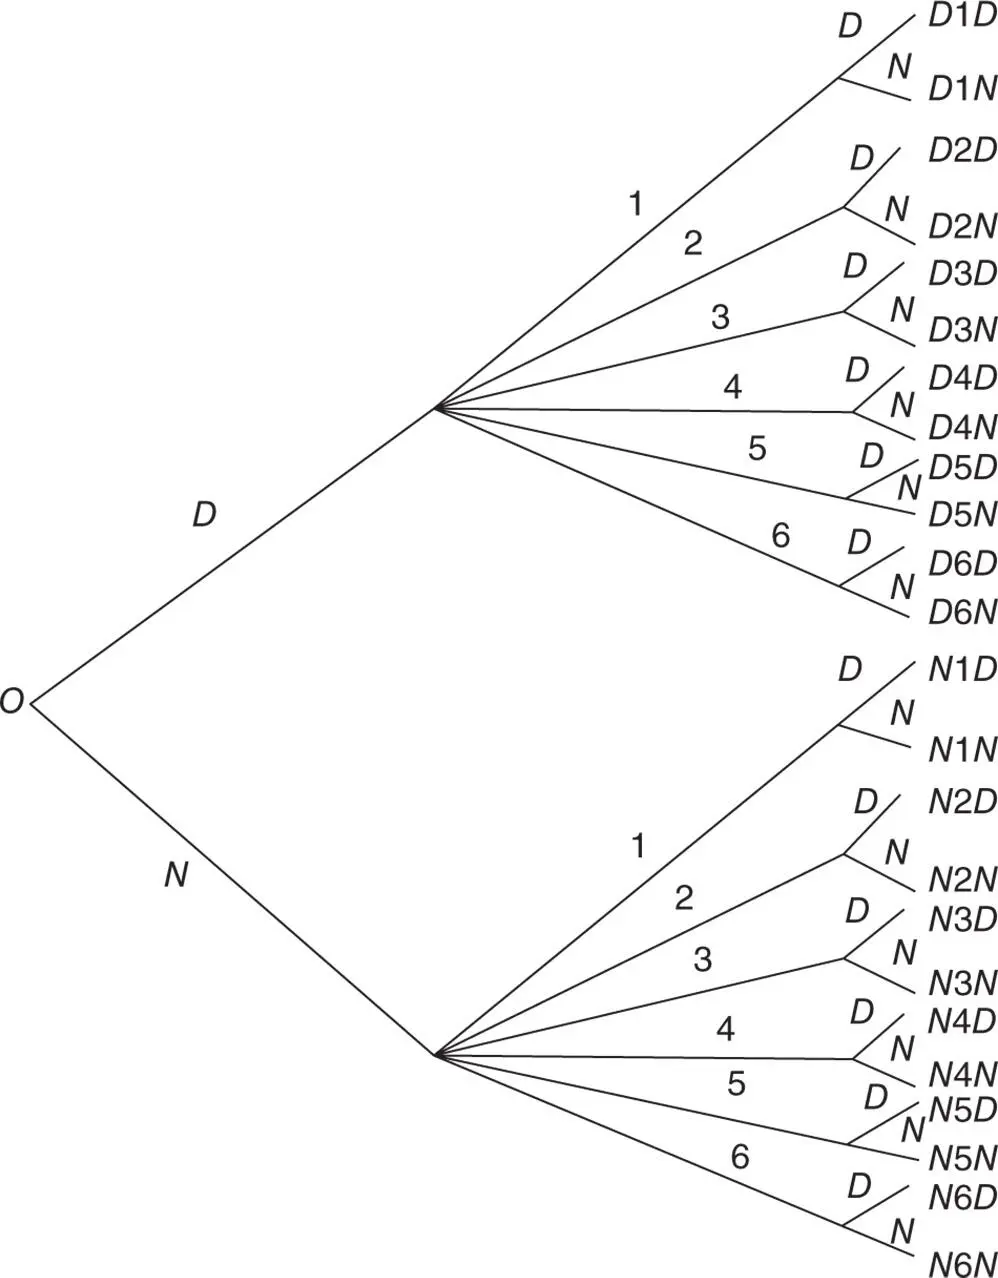
Figure 3.4.1Tree diagram for the experiment in Example 3.3.1
Example 3.4.1(Constructing a tree diagram) Consider a random experiment consisting of three trials. The first trial is testing a chip taken from the production line, the second is randomly selecting a part from the box containing parts produced by six different manufacturers, and the third is, again, testing a chip off the production line. The interest in this experiment is in describing and listing the sample points in the sample space of the experiment.
Solution:A tree‐diagram technique describes and lists the sample points in the sample space of the experiment consisting of three trials. The first trial in this experiment has two possible outcomes: the chip could be defective ( D ) or nondefective ( N ); the second trial has six possible outcomes because the part could come from manufacturer 1, 2, 3, 4, 5, or 6; and the third, again, has two possible outcomes ( D, N ). The problem of constructing a tree diagram for a multitrial experiment is sequential in nature: that is, corresponding to each trial, there is a step of drawing branches of the tree. The tree diagram associated with this experiment is shown in Figure 3.4.1.
The number of sample points in a sample space is equal to the number of branches corresponding to the last trial. For instance, in the present example, the number of sample points in the sample space is equal to the number of branches corresponding to the third trial, which is 24 (  ). To list all the sample points, start counting from o along the paths of all possible connecting branches until the end of the final set of branches, listing the sample points in the same order as the various branches are covered. The sample space S in this example is
The tree diagram technique for describing the number of sample points is extendable to an experiment with a large number of trials, where each trial has several possible outcomes. For example, if an experiment has n trials and the i th trial has  possible outcomes (
  ), then there will be
  branches at the starting point o,
  branches at the end of each of the
  branches,
  branches at the end of the each of
  branches, and so on. The total number of branches at the end would be
  , which represents all the sample points in the sample space S of the experiment. This rule of describing the total number of sample points is known as the Multiplication Rule .
Интервал:
Закладка:
Похожие книги на «Statistics and Probability with Applications for Engineers and Scientists Using MINITAB, R and JMP»
Представляем Вашему вниманию похожие книги на «Statistics and Probability with Applications for Engineers and Scientists Using MINITAB, R and JMP» списком для выбора. Мы отобрали схожую по названию и смыслу литературу в надежде предоставить читателям больше вариантов отыскать новые, интересные, ещё непрочитанные произведения.


Обсуждение, отзывы о книге «Statistics and Probability with Applications for Engineers and Scientists Using MINITAB, R and JMP» и просто собственные мнения читателей. Оставьте ваши комментарии, напишите, что Вы думаете о произведении, его смысле или главных героях. Укажите что конкретно понравилось, а что нет, и почему Вы так считаете.