George P. Nassos - Practical Sustainability Strategies
Здесь есть возможность читать онлайн «George P. Nassos - Practical Sustainability Strategies» — ознакомительный отрывок электронной книги совершенно бесплатно, а после прочтения отрывка купить полную версию. В некоторых случаях можно слушать аудио, скачать через торрент в формате fb2 и присутствует краткое содержание. Жанр: unrecognised, на английском языке. Описание произведения, (предисловие) а так же отзывы посетителей доступны на портале библиотеки ЛибКат.
- Название:Practical Sustainability Strategies
- Автор:
- Жанр:
- Год:неизвестен
- ISBN:нет данных
- Рейтинг книги:3 / 5. Голосов: 1
-
Избранное:Добавить в избранное
- Отзывы:
-
Ваша оценка:
Practical Sustainability Strategies: краткое содержание, описание и аннотация
Предлагаем к чтению аннотацию, описание, краткое содержание или предисловие (зависит от того, что написал сам автор книги «Practical Sustainability Strategies»). Если вы не нашли необходимую информацию о книге — напишите в комментариях, мы постараемся отыскать её.
sustainable strategies and tools to improve competitive business advantage, updated with practical case studies and supporting teaching material
The revised and updated second edition of
is filled with proven strategies and tools for organizations to integrate sustainability into their business models. Drawing on the authors’ research and years of hands-on experience, the book defines strategies that organizations can put in place to develop, extend, or maintain competitive advantage without harming the environment. Additionally, the authors provide tools for measuring and reporting progress and present illustrative case studies that clearly demonstrate the importance of implementing sustainability.
Since the first edition was published in 2013, new strategies, measurements, and certifications have been developed. The book, which is used by several business schools around the globe, has been updated to include these new and effective strategies, including circular economy, the sharing economy, adaptation, resiliency, and strategies to fight climate change. This new edition also highlights the UN Sustainable Development Goals that have been adopted worldwide. This updated second edition:
Covers new strategies, measuring systems, GRI, STARS and B-Lab certifications Offers teaching slides and questions for use in the classroom Explores the principles and importance of sustainability Examines more than 10 different sustainability strategies Presents the economic justification for sustainability with illustrative examples Written for sustainability managers, ESG professionals, engineers, process designers, policy makers, CEOs, business schools, and others, the second edition of
offers an updated guide to the most recent strategies and tools that can be put into place to improve competitive advantage, while also providing a positive impact to the community and workplace.
Practical Sustainability Strategies — читать онлайн ознакомительный отрывок
Ниже представлен текст книги, разбитый по страницам. Система сохранения места последней прочитанной страницы, позволяет с удобством читать онлайн бесплатно книгу «Practical Sustainability Strategies», без необходимости каждый раз заново искать на чём Вы остановились. Поставьте закладку, и сможете в любой момент перейти на страницу, на которой закончили чтение.
Интервал:
Закладка:
The earth's surface is about 71% water; however, 97% of all the water on earth is saline. Of the remaining 3%, 68.7% is in the form of icecaps and glaciers, 30.1% is ground water, and 0.9% is in some other unavailable form. This leaves only 0.3% of the fresh water on earth available to us on the surface with 87% in lakes, 11% in swamps, and 2% in rivers. This means that only 0.1% of all the water on the earth is available for industrial, agricultural, and human use. And of these three general uses, 70% is for agricultural use, 20% for industrial use, and only 10% for human consumption. Going further with the calculations results in only 0.01% of all the water on the earth being consumed by humans, and as the population grows, that leaves less for everyone.
According to the United Nations, two-thirds of the world's population is projected to face water scarcity by 2025. In the United States, a federal report [12] by the General Accounting Office shows that 40 of the 50 states are anticipating water shortages by 2023. In 2008, the state of Georgia tried, unsuccessfully, to move the state's border north in order to claim part of the Tennessee River.
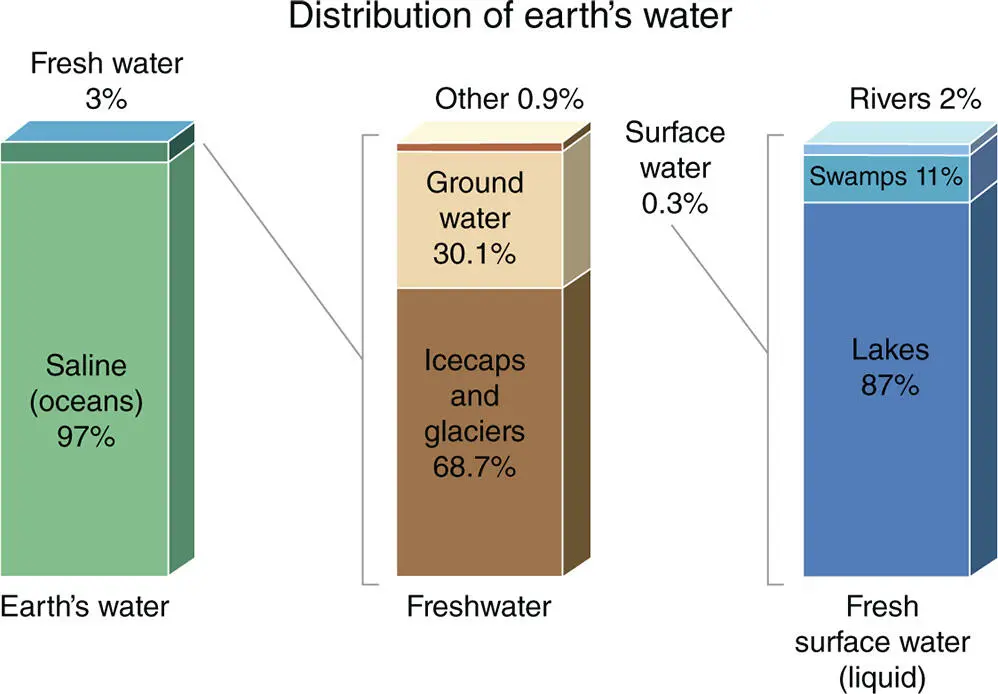
FIGURE 1.2 Distribution of earth's water.
The concern for this water shortage is partly due to the companies that require so much for their processes. It takes roughly 20 gal of water to make a pint of beer, about 130 gal of water to make a 2 l bottle of pop, and about 2000 gal of water to make a pair of Levi's stonewashed jeans. Why so much? For the pop, it includes the water used to grow the ingredients such as sugar cane. For the jeans, it includes the water used to grow, dye, and process the cotton.
Companies are now calculating the “water footprint” in order to manage better the water consumption. This is not dissimilar to the carbon footprint that organizations and individuals have been calculating for some years. The water-footprint concept was first developed in 2002 by A.Y. Hoekstra at the University of Twente in the Netherlands [13]. Following the water-footprint concept, studies were conducted to calculate the embedded, or virtual, water required for a product, which was then added to what is consumed directly. Embedded water includes everything from raising beef in South America, growing oranges in Spain, or growing cotton in Asia. By calculating the embedded water, you would learn that a typical hamburger takes 630 gal of water to produce. Most of the water is used to grow the grain to feed the cattle. This represents more than three times the amount the average American uses every day for drinking, bathing, washing dishes, and flushing toilets.
At first glance, these large numbers representing water footprints for certain products seem very alarming. However, they are not necessarily bad if there is available water and it is well managed. Since most of the water is used for crops, it becomes part of the water cycle where it is eventually evaporated or it is runoff. This water becomes temporarily unavailable for other uses, but that is not really a problem in an area that has plentiful water. If it doesn't return to the same aquifer or it returns as rainfall in another region, this could be a problem.
THE DEPLETION OF FOSSIL FUELS
In 1956, M. King Hubbert, a scientist with Shell Oil, proposed that fossil fuel production in a given region over time would follow a roughly bell-shaped curve without giving a precise formula [14]. Hubbert assumed that after fossil fuel reserves are discovered, production at first increases approximately exponentially, as more extraction commences and more efficient facilities are installed. At some point, a peak output is reached, and production begins declining until it approximates an exponential decline as shown in Figure 1.3.
The Hubbert curve suggests that the oil production rate increases as more reserves are discovered, and the rate peaks when half the estimated ultimately recoverable oil is produced. This is followed by a falling production rate, all along a classic bell curve. This same analysis has shown that it took 110 years to produce about 225 billion barrels of crude oil in the United States, but half of that oil was produced in the first 100 years and the second half in the next 10 years. In the United States, Hubbert predicted that this production rate peak would be achieved in 1970, the year when half of the estimated ultimately recoverable oil was utilized and then production would start its steady decline. That in fact is what happened when the United States lost its preeminence as the world's leading producer of oil and caused a spike in gasoline prices and long lines at the pumps. His prediction that the United States would peak in oil production in 1970 actually came true although it peaked 17% higher than he projected, and its pathway since has not followed the bell-shaped curve he predicted. On a global basis, this milestone was expected to occur around the year 2010. What has happened since Hubbert's predictions is that more reserves have been discovered and new extraction technologies have been applied? It is now expected that the current oil reserves will last another 50 years [15]. Based on a similar analysis, natural gas reserves are good for 53 more years and coal reserves for at least 100 years.
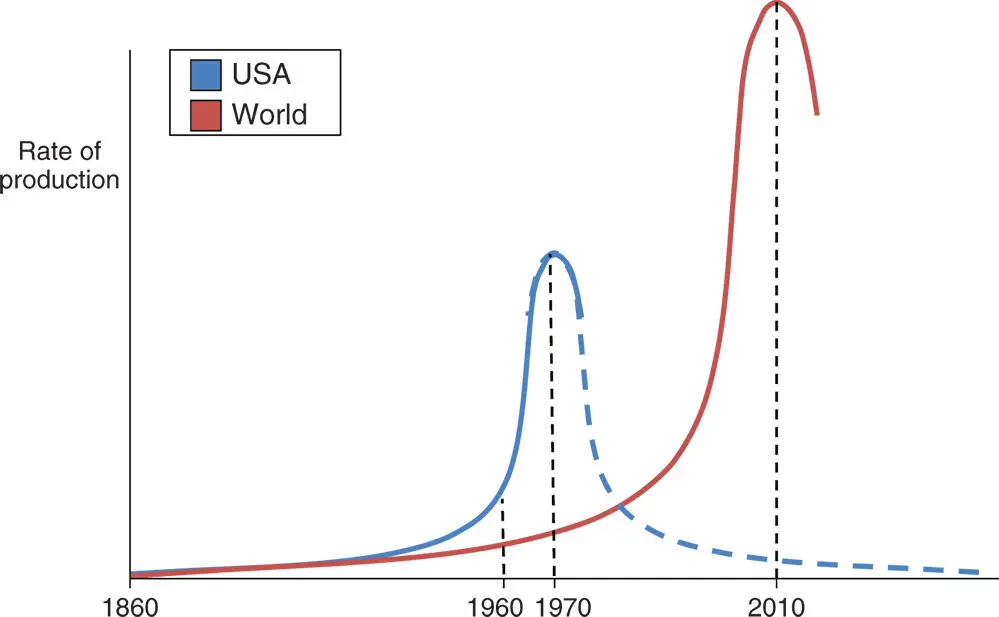
FIGURE 1.3 Hubbert's peak.
CLIMATE CHANGE
In 1988, the United Nations General Assembly created the Intergovernmental Panel on Climate Change (IPCC) with the task of reviewing and assessing the most recent scientific, technical, and socio-economic information produced worldwide relevant to the understanding of climate change. Further, it would provide the world with a clear scientific view on the then current state of climate change and its potential environmental and socio-economic consequences, notably the risk of climate change caused by human activity.
The first assessment report of the IPCC was presented in 1990 and along with subsequent reports led scientists to conclude that the earth cannot tolerate more than a 3–5 °F increase in temperature. In order not to exceed this level, the carbon dioxide emissions must be reduced 60–80% of the 1990 levels by the year 2050. The first in a series of international meetings took place in 1992 in Rio de Janeiro, Brazil, called the Rio Earth Summit. As a result of that meeting, five years later the Kyoto Protocol was adopted. It recognized that climate change was a result of greenhouse gases (GHGs) created by human industrial activity. The idea was that rich nations, which had already benefited from industrialization, would reduce their GHG emissions in the first part of the treaty and developing nations would join in later. Milestones were created in various intervals through the year 2050. One of the milestones was to reduce GHG 5% below 1990 levels by 2012. Instead, the world increased GHG by 58% above 1990 levels as the Kyoto Protocol came to an end.
At the next international meeting, which took place in Doha, Qatar, at the end of 2012, the developing countries once again demanded, as they did in Kyoto in 1997, for the rich countries to make a commitment to set real targets for reducing their GHG output. The rich nations then agreed to make some commitment toward a stronger legal agreement when they meet in Paris in 2015.
The primary goals of the Paris Agreement were to hold the increase in the global average temperature to less than 2 °C from pre-industrial levels, but also achieve net zero GHG emissions beginning in 2050. Each country made a pledge to reduce carbon emissions commensurate with its rate of emissions along with its technical ability For instance, the United States committed to reducing emissions 26–28% below 2005 levels by 2025. To achieve these goals, the public and private sectors must act boldly and quickly to reduce the use of fossil fuels and increase renewables as quickly as possible. In addition, if the technology can be developed, sequestering more carbon from the atmosphere would really enhance the goals of the agreement.
Читать дальшеИнтервал:
Закладка:
Похожие книги на «Practical Sustainability Strategies»
Представляем Вашему вниманию похожие книги на «Practical Sustainability Strategies» списком для выбора. Мы отобрали схожую по названию и смыслу литературу в надежде предоставить читателям больше вариантов отыскать новые, интересные, ещё непрочитанные произведения.


Обсуждение, отзывы о книге «Practical Sustainability Strategies» и просто собственные мнения читателей. Оставьте ваши комментарии, напишите, что Вы думаете о произведении, его смысле или главных героях. Укажите что конкретно понравилось, а что нет, и почему Вы так считаете.