S. Jane Flint - Principles of Virology, Volume 2
Здесь есть возможность читать онлайн «S. Jane Flint - Principles of Virology, Volume 2» — ознакомительный отрывок электронной книги совершенно бесплатно, а после прочтения отрывка купить полную версию. В некоторых случаях можно слушать аудио, скачать через торрент в формате fb2 и присутствует краткое содержание. Жанр: unrecognised, на английском языке. Описание произведения, (предисловие) а так же отзывы посетителей доступны на портале библиотеки ЛибКат.

- Название:Principles of Virology, Volume 2
- Автор:
- Жанр:
- Год:неизвестен
- ISBN:нет данных
- Рейтинг книги:3 / 5. Голосов: 1
-
Избранное:Добавить в избранное
- Отзывы:
-
Ваша оценка:
Principles of Virology, Volume 2: краткое содержание, описание и аннотация
Предлагаем к чтению аннотацию, описание, краткое содержание или предисловие (зависит от того, что написал сам автор книги «Principles of Virology, Volume 2»). Если вы не нашли необходимую информацию о книге — напишите в комментариях, мы постараемся отыскать её.
Volume I: Molecular Biology
Volume II: Pathogenesis and Control
Principles of Virology, Fifth Edition
Principles of Virology, Volume 2 — читать онлайн ознакомительный отрывок
Ниже представлен текст книги, разбитый по страницам. Система сохранения места последней прочитанной страницы, позволяет с удобством читать онлайн бесплатно книгу «Principles of Virology, Volume 2», без необходимости каждый раз заново искать на чём Вы остановились. Поставьте закладку, и сможете в любой момент перейти на страницу, на которой закончили чтение.
Интервал:
Закладка:
Imagine that, in a city of 200,000 residents, a virus causes infection of 50,000 persons (as determined by serology). Of these, 20,000 develop signs of illness and 10,000 die of the infection.
The incidence of this infection is the number of people infected divided by the population (50,000/200,000, or 25%).
Morbidity rate is the number of individuals who became ill divided by the number of individuals at risk (20,000/200,000, or 10%).
Mortality rate is the number of deaths divided by the number of individuals who are at risk (10,000/200,000, or 5%).
The case fatality ratio is the proportion of deaths within a population of infected individuals. This value is typically expressed as a percentage. Case fatality ratios are most often used for diseases with discrete, limited time courses, such as outbreaks of acute infections. In the above example, the case fatality ratio is the number of deaths divided by the number of individuals with illness (10,000/20,000, or 50%).
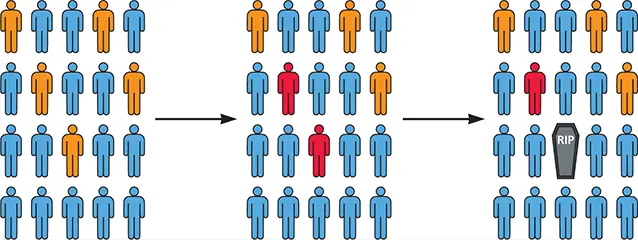
Representation of incidence, morbidity, and mortality rates in a population.Each person represents 10,000 members of a community, as in the example above. Orange individuals are those who are infected; red are those who show symptoms of infection; the coffin indicates those who have died of the infection.
As a real-world example, Nipah virus infection and resulting encephalitis in Southeast Asia in 2011–12 resulted in 280 cases and 211 deaths, a staggering case fatality ratio of 75%.
In contrast, retrospective studies are not encumbered by the need for large numbers of subjects and long study times. Instead, some number of subjects with the disease or side effect under investigation is selected, as is an equal number of subjects who do not have the disease. The presence of the variable under study is then determined for each group. For example, in one retrospective study of measles virus vaccine safety and childhood autism, a cohort of vaccinated children and an equivalent cohort of age-matched, unvaccinated children were chosen randomly. The proportion of children with autism was then calculated for each group to determine if the rate of occurrence of autism in the vaccinated group was higher, lower, or the same as in the unvaccinated group. The incidence of the side effect in each group is then calculated; the ratio of these values between groups is the relative risk associated with vaccination. In this example, the rate of autism was not found to be different in the two groups, showing that vaccination is not a risk factor for the development of this disorder ( Chapter 7).
Mortality, Morbidity, and Case Fatality Ratios
Three other measures used in epidemiology can cause confusion because of the similarity of their definitions: mortality, morbidity, and case fatality ratios( Box 1.5). The mortality rate is expressed as a percentage of deaths in a known population of infected individuals normalized to the whole population in a period of time. The morbidity rate is similar but refers to the number of infected individuals in a given population who show symptoms of infection. The morbidity percentage will always be higher than the mortality percentage, of course, because not all sick individuals will die of the infection.
In contrast, a case fatality ratio is a measure of the number of deaths among clinical cases of the disease, expressed as a percentage. As an example, if 200 people are diagnosed with a respiratory tract infection and 16 of them die, the case fatality ratio would be 16/200, or 8%. In a technical sense, the use of the word “ratio” is incorrect; a case fatality ratio is more a measure of relative risk than a comparison between two numbers.
R-naught ( R 0)
Virus particles must spread from host to host to maintain a viable population. Spreading will occur if, on average, each infected host passes the agent to more than one new host before the original host dies or clears the infection. The probability of such transmission is related to the size of the host population: infections can spread only if population density exceeds a minimal value. These concepts have been incorporated into a comprehensive theory of host-parasite interactions that is well known in ecological circles, but not always appreciated. This theory describes the parameters of viral infection in quantitative terms. The basic reproductive number for a virus population, R 0(pronounced “R-naught”), is de fined as the number of secondary infections that can arise in a large population of susceptible hosts from a single infected individual during its life span. If R 0is <1, it is impossible to sustain an epidemic; in fact, it may be possible to eradicate the pathogen, especially if the species of hosts that it infects is limited. If R 0is >1, an epidemic is possible, but random fluctuations in the number of transmissions in the early stages of infection in a susceptible population can lead to either extinction or explosion of the infection. If R 0is muchgreater than 1, an epidemic (or perhaps a pandemic) is almost certain ( Table 1.1). The proportion of the susceptible population that must be vaccinated to prevent virus spread is calculated as 1—1/ R 0. In the simplest model, R 0= tau × c × d , where tau is the probability of infection, given contact between an infected and uninfected host; c is the average duration of contact between them; and d is the duration of infectivity. Consequently, the longer the exposure among individuals and the length of the infectious period, the higher R 0will be.
The original host-parasite theory assumed well-mixed, homogeneous host populations in which each individual host has the same probability of becoming infected. Although the general concepts remain valid, additional parameters and constraints have been added to the mathematical models as more has been learned about population diversity and the dynamics of viral infections ( Chapter 10). For example, immune-resistant viral mutants with differences in virulence and transmissibility can be selected, and some individuals (called super transmitters) can pass infection to others much more readily than the majority. We also now know that virus populations are more diverse than first imagined, and the constellation of possible host populations affects their evolution in ways not easily captured by mathematical equations. Consequently, although the calculations are useful indications of the thresholds that govern the spread of a virus in a population (that is, they help to determine if a disease is likely to die out[ R 0is <1] or become endemic [ R 0is >1]), they cannot be used to compare possible outcomes in particular cases or for different diseases.
Table 1.1 Reproductive numbers for selected viruses
| Virus | R 0 a |
|---|---|
| Measles | 12–18 |
| Smallpox | 5–7 |
| Polio | ∼7 |
| SARS–CoV–2 | 2–3 |
| Influenza | |
| 2009 (H1N1) | 1.47 |
| 1957, 1968 pandemics | 1.8 |
| 1918 pandemic | 2.4–5.4 |
| Ebola | 1.3–1.8 b |
aValues from Centers for Disease Control and Prevention website.
bSource: Chowell G et al. 2004. J Theoret Biol 229:199–126.
While mathematical formulas and statistics are crucial to all studies in virology, they are of particular value in viral epidemiology. An understanding of some essential principles concerning the use of statistics in virology is provided in Box 1.6.
Читать дальшеИнтервал:
Закладка:
Похожие книги на «Principles of Virology, Volume 2»
Представляем Вашему вниманию похожие книги на «Principles of Virology, Volume 2» списком для выбора. Мы отобрали схожую по названию и смыслу литературу в надежде предоставить читателям больше вариантов отыскать новые, интересные, ещё непрочитанные произведения.


Обсуждение, отзывы о книге «Principles of Virology, Volume 2» и просто собственные мнения читателей. Оставьте ваши комментарии, напишите, что Вы думаете о произведении, его смысле или главных героях. Укажите что конкретно понравилось, а что нет, и почему Вы так считаете.