International and national valuation standards have become more demanding in regulating communication between clients and appraisers. This communication involves the selection and appointment of an appraiser as well as the reporting of the valuation itself. There has been concern over the relationship between valuers and their clients, and academic research discussed below has suggested reasons why valuations might not be totally accurate and objective. The data now exists in some mature property markets to undertake long-term analyses of valuation accuracy and bias (measuring how close Market Value estimates were to subsequent sale prices). This includes variation between different valuers, the extent to which valuers anchor on past evidence and smooth peaks and troughs within cyclical markets, and whether valuers succumb to pressure from clients and other stakeholders in the process, and alter valuations as a result.
1.3.1 Accuracy, Bias, Smoothing, and Lagging of Valuations
Since valuations are estimates of what the exchange price or investment worth might be, it follows that such estimates are subject to a degree of uncertainty. The principle of uncertainty around valuations is now firmly embedded in valuation standards and both the IVSC and the RICS have addressed this with guidance on reporting uncertainty around the valuation and its causes (IVSC 2019; RICS 2014). These discussions around the reporting of uncertainty have been given added momentum by the GFC and COVID-19 globally and Brexit within the UK. For example the “RICS Material Valuation Uncertainty Leaders Forum” meets weekly during any “unusual” events that may cause valuations to be subject to abnormal uncertainty and both RICS and IVSC have produced additional advice in 2020 in response to the COVID-19 pandemic (IVSC, 2020; RICS 2020b). Nonetheless, there is an expectation that appraisers will produce a solution that lies within certain parameters. In some countries, these parameters have been discussed by courts during valuation negligence cases.
Meanwhile, the degree of variation from prices or from other valuations has been examined in a number of studies. These have taken place for the large property investment markets of the UK and US, as well as for parts of mainland Europe, Australasia, Asia, and Africa. Crosby (2000) reviews studies for the UK, US, and Australia conducted during the 1990s. Since then, Cannon and Cole (2011) analysed 7,214 sales of apartment, retail, office, and industrial properties in the US over the period 1984–2010 for which performance measurement appraisals had been previously undertaken. Cannon and Cole found an average difference of +3.9%, with prices higher than valuations. This hid larger positive differences for times when market prices had appreciated, while during a declining market in 2008 and 2009 average differences were negative, with valuations higher than prices. The findings suggest that market valuations could be biased estimates of sale prices, but that the direction of bias changes between rising and falling markets. This is consistent with the hypothesis that appraisals are lagged indicators of value.
Measurements of the average difference allow positive and negative differences to at least partly cancel out. The absolute average is, therefore, another common metric in such studies, capturing the typical difference between valuations and prices regardless of which was higher or lower in any given instance. In Cannon and Cole (2011), the average absolute difference across the 25 years studied was 12.5%.
Another source of evidence is a series of regular studies carried out by MSCI. The last 30 years of the MSCI UK database has been examined by these studies to make similar comparisons of prices and valuations. Some of the results from these exercises are illustrated in Figure 1.1.
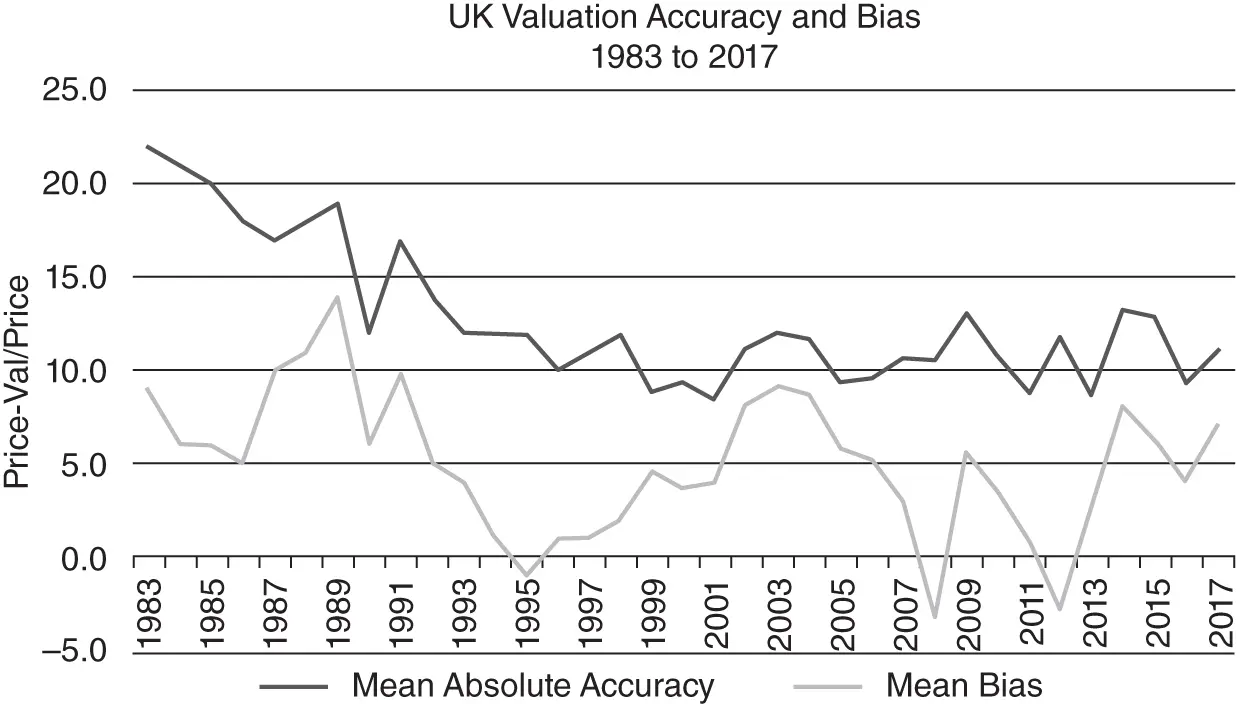
Figure 1.1 UK valuation accuracy and bias (value weighted figures): 1983 to 2017.
Source: RICS/IPD (2005), RICS (2019), and Reid (2016).
Over the whole period, the average mean difference between valuations and subsequent sale prices has been around 5%, with prices higher than valuations. This suggests a bias to under-valuation. The average mean absolute difference has been around 13%. Both of these figures mask substantial changes during the period. The absolute difference fell during the 1980s and 1990s before stabilising at around 8–10%.
If appraisals keep pace with how prices are changing, there should be no pattern to how the mean difference changes over time. However, the same pattern emerges in the UK results as in the US results discussed above. In the boom years of the late 1980s, valuations appear to have lagged further and further behind prices, suggesting that they rose at a lower rate than that at which prices were rising. Then, in the recession of the early 1990s, they seem to have followed prices down at a slower rate than prices were falling. After five years of falling and then static prices, valuations caught up in 1995, only to be left behind as property markets started to rise again post-1995. The pattern repeated itself in the years 2001–2009, but the catching up process in the downturn was much faster in this case, with valuations higher than prices in 2008. Since then, a positive mean difference, with prices higher than valuations on average, has re-emerged.
This type of analysis has been extended by MSCI to 12 nations where a long time series of valuation-based performance figures exists: Australia, Canada, France, Germany, Italy, Japan, Netherlands, South Africa, Sweden, Switzerland, the UK, and the US. Tables 1.1and 1.2set out the mean absolute difference and the mean difference (or bias) for those countries over the period from 2000 to 2018. The results shown in Table 1.2are particularly worthy of comment. Many markets recorded their largest positive mean difference (with prices higher than valuations) in 2006 or 2007, during which the peak of the last global property cycle was reached. The UK, the US, and Sweden then had valuations higher than prices in 2008, while Germany, Japan, the Netherlands, Canada, and Australia had reversed by the end of 2009, with valuations higher than prices.
Table 1.1 Weighted average absolute differences between valuations and prices 2000 to 2018, by country.
Source: MSCI (2019).
|
2000 |
2001 |
2002 |
2003 |
2004 |
2005 |
2006 |
2007 |
2008 |
2009 |
2010 |
2011 |
2012 |
2013 |
2014 |
2015 |
2016 |
2017 |
2018 |
| Australia |
3.8 |
3.9 |
4.4 |
4.8 |
4.8 |
5.5 |
9.5 |
13.7 |
10.1 |
8.2 |
5.6 |
6.6 |
3.6 |
5.8 |
9.2 |
13.1 |
8.8 |
11.9 |
10.5 |
| Canada |
7.4 |
6.4 |
9.7 |
8.1 |
9.3 |
11.6 |
15.7 |
13.4 |
8.8 |
9.9 |
8.2 |
10.7 |
16.7 |
7.4 |
9.5 |
15.6 |
12.0 |
9.2 |
13.1 |
| France |
6.6 |
7.9 |
6.6 |
5.4 |
11.5 |
10.2 |
14.5 |
12.9 |
9.9 |
7.8 |
11.1 |
12.6 |
9.7 |
9.2 |
9.3 |
12.7 |
12.8 |
9.8 |
11.1 |
| Germany |
12.2 |
9.2 |
7.1 |
11.6 |
5.0 |
6.0 |
14.3 |
14.3 |
14.8 |
6.1 |
11.2 |
9.6 |
10.0 |
7.9 |
8.4 |
9.9 |
13.4 |
18.1 |
9.7 |
| Italy |
|
20.5 |
12.7 |
7.9 |
19.1 |
4.7 |
9.3 |
14.0 |
17.5 |
12.5 |
12.2 |
7.6 |
10.0 |
6.9 |
9.2 |
8.6 |
8.6 |
10.8 |
17.7 |
| Japan |
|
|
|
4.2 |
14.3 |
22.3 |
8.1 |
12.9 |
7.3 |
10.2 |
8.6 |
8.2 |
12.0 |
11.6 |
10.9 |
14.0 |
13.0 |
9.5 |
11.7 |
| Netherlands |
10.2 |
8.4 |
9.0 |
8.1 |
8.2 |
8.6 |
11.6 |
12.4 |
5.6 |
9.3 |
4.8 |
5.1 |
7.5 |
9.5 |
5.8 |
7.1 |
10.2 |
10.1 |
10.2 |
| South Africa |
10.9 |
9.2 |
9.2 |
8.1 |
6.9 |
11.4 |
9.2 |
21.7 |
9.5 |
9.4 |
6.9 |
10.6 |
10.1 |
9.3 |
9.2 |
3.7 |
5.2 |
3.6 |
4.8 |
| Sweden |
18.5 |
9.6 |
10.1 |
8.0 |
10.0 |
10.4 |
21.6 |
15.8 |
13.7 |
16.7 |
9.0 |
16.1 |
7.9 |
10.8 |
10.8 |
13.0 |
12.4 |
8.6 |
9.2 |
| Switzerland |
|
|
23.9 |
10.3 |
9.1 |
8.5 |
8.2 |
9.4 |
9.1 |
13.5 |
11.3 |
10.7 |
12.3 |
7.5 |
7.2 |
19.2 |
23.9 |
19.5 |
10.3 |
| UK |
7.8 |
7.1 |
7.6 |
7.5 |
7.9 |
7.8 |
8.9 |
9.9 |
9.4 |
11.2 |
9.7 |
9.7 |
8.7 |
10.3 |
10.9 |
10.1 |
8.6 |
9.0 |
8.5 |
| USA |
5.1 |
8.6 |
7.7 |
6.3 |
9.6 |
11.6 |
10.8 |
10.3 |
8.6 |
14.9 |
10.1 |
9.9 |
9.0 |
10.4 |
8.5 |
8.1 |
6.2 |
7.0 |
6.7 |
| Other |
10.7 |
16.3 |
8.1 |
9.2 |
14.4 |
15.5 |
17.6 |
13.6 |
10.4 |
12.6 |
10.5 |
9.0 |
8.3 |
10.1 |
9.5 |
10.9 |
13.6 |
12.6 |
12.4 |
| Global |
8.6 |
7.3 |
7.6 |
7.3 |
8.4 |
9.2 |
11.5 |
11.9 |
10.1 |
11.1 |
9.4 |
9.9 |
9.2 |
9.4 |
9.4 |
10.3 |
9.2 |
9.3 |
9.0 |
Table 1.2 Weighted average differences between valuations and prices 2000 to 2018, by country.
Читать дальше
