EIB Investment Report 2020/2021
Здесь есть возможность читать онлайн «EIB Investment Report 2020/2021» — ознакомительный отрывок электронной книги совершенно бесплатно, а после прочтения отрывка купить полную версию. В некоторых случаях можно слушать аудио, скачать через торрент в формате fb2 и присутствует краткое содержание. Жанр: unrecognised, на английском языке. Описание произведения, (предисловие) а так же отзывы посетителей доступны на портале библиотеки ЛибКат.
- Название:EIB Investment Report 2020/2021
- Автор:
- Жанр:
- Год:неизвестен
- ISBN:нет данных
- Рейтинг книги:5 / 5. Голосов: 1
-
Избранное:Добавить в избранное
- Отзывы:
-
Ваша оценка:
EIB Investment Report 2020/2021: краткое содержание, описание и аннотация
Предлагаем к чтению аннотацию, описание, краткое содержание или предисловие (зависит от того, что написал сам автор книги «EIB Investment Report 2020/2021»). Если вы не нашли необходимую информацию о книге — напишите в комментариях, мы постараемся отыскать её.
EIB Investment Report 2020/2021 — читать онлайн ознакомительный отрывок
Ниже представлен текст книги, разбитый по страницам. Система сохранения места последней прочитанной страницы, позволяет с удобством читать онлайн бесплатно книгу «EIB Investment Report 2020/2021», без необходимости каждый раз заново искать на чём Вы остановились. Поставьте закладку, и сможете в любой момент перейти на страницу, на которой закончили чтение.
Интервал:
Закладка:
EU GDP increased 13% in the third quarter of 2020 compared to the second quarter, recovering some of its losses.This increase is not surprising as most EU governments relaxed restrictions on movement and economic activity substantially in the third quarter. The biggest increases were in France, Spain and Italy, where GDP had declined by more than the EU average. While substantial, the increase in the third quarter still left EU real GDP 4% lower than the level in the same period a year earlier.
Significant declines in private consumption drove the decline in real GDP in the second quarter (Figure 10).Constrained private consumption accounted, on average, for about two-thirds of the total decline in GDP. Lower consumption represented around one-third or less of the total decline in only four countries.[2] In addition to the restrictions on shopping, private consumption most likely declined because many workers were uncertain about their jobs. In the European Commission’s Business and Consumer surveys, measures – such as unemployment expectations or respondents’ expectations for their financial situation in the next 12 months – indicated consumer anxiety ( Figure 11a).
The decline in investment was the second largest cause of the overall contraction in the European Union’s GDP.Investment accounted for about one-third of the decrease, compared with only 14% in the United States. Within the European Union, the depth of the decline varied widely, ranging from just below 2% in Finland to 50% in Luxembourg. In general, the contribution of investment to the fall in GDP was higher in Western and Northern Europe (34%) than in Southern (21%) and Central and Eastern Europe (19%). Uncertainty is very likely to have played a larger role in the contraction in investment than government restrictions. Chapter 2provides a more in-depth analysis of this drop in investment.
Figure 10
Real GDP change in H1 2020 and contribution of aggregate demand(percentage change in Q2 2020 vs. Q4 2019)
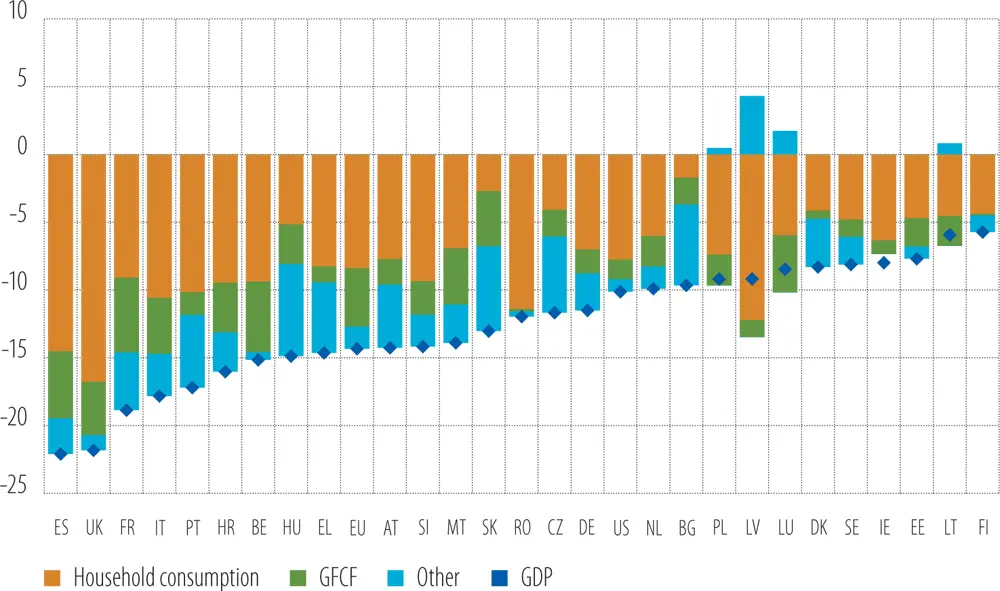
Source: Eurostat, OECD national accounts and EIB staff calculations.
Note: Other includes government consumption expenditure, net export and change in inventories.
Figure 11
Consumer expectations for the next 12 months and real disposable income per capita
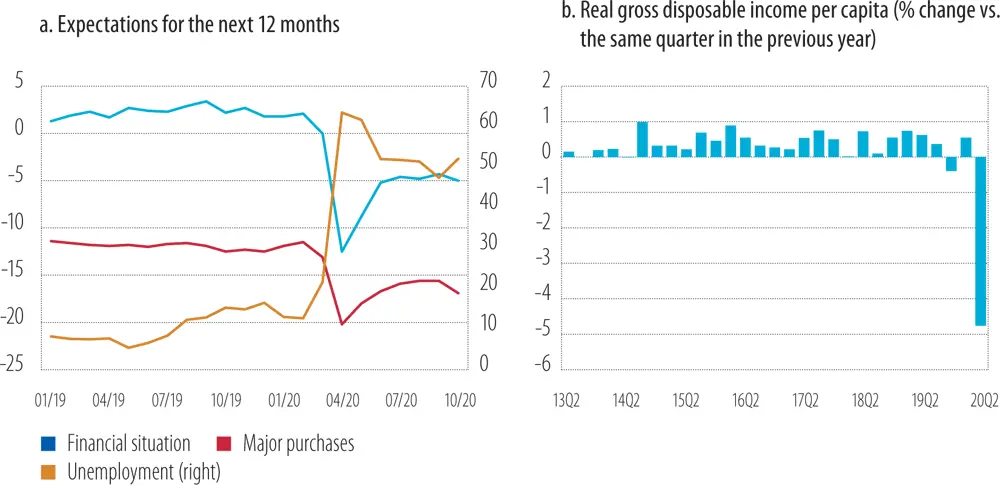
Source: European Commission’s Business and Consumer Surveys and Eurostat.
Expectations about future consumption do not suggest a rapid recovery in GDP (Figure 11a).Consumers’ expectations about their financial situation and their willingness to make major purchases in the next 12 months improved to some extent in June and July. Those expectations stabilised in August and September, but they were well below levels seen before the pandemic. The expectations started to deteriorate again in October as the pandemic intensified again across EU members. Disposable income per capita fell sharply in the second quarter of 2020, and this decline will affect consumer spending, especially for lower-income, liquidity-constrained households ( Figure 11b). Such developments in income and consumer expectations make a quick rebound in consumer spending somewhat unlikely, even though strict government restrictions on movement have been largely avoided in the fourth quarter of 2020. The corporate sector is not optimistic about investment either, as discussed in detail in Chapter 2. The economic recovery is therefore likely to be more gradual and prolonged ( Box A).
Box A
Real-time monitoring of the pandemic’s impact
Since the start of the pandemic, new data sources have become available that help assess economic activity in almost real time. Oxford University coordinates an effort to compile daily indicators of policy stringency (Blavatnik School of Government, 2020). Google provides daily measures of the extent to which people, under these restrictions, are still going to work (Google, 2020). Policies and mobility vary substantially across EU Member States but still show a common pattern ( Figure A.1).
Figure A.1
Indicators of policy stringency and mobility trace the impact of the first and second waves of the pandemic, with significant diversity across EU countries
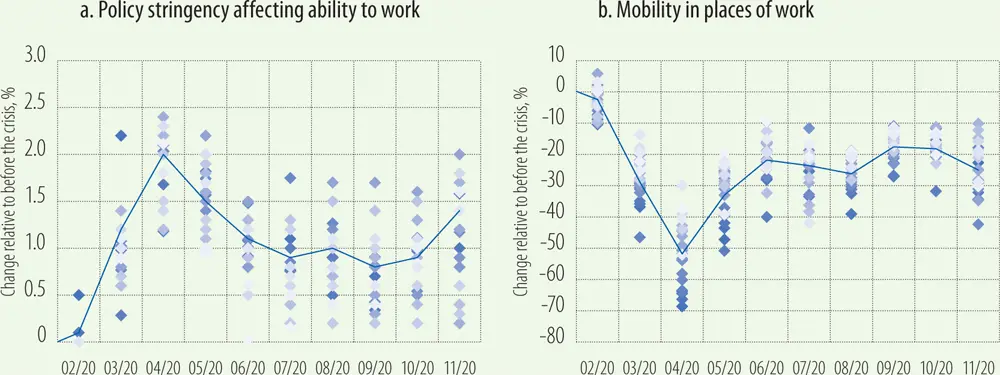
Source: Blavatnik School of Government (2020), Google (2020), and EIB staff calculations.
Note: Monthly averages of work-related measures of policy stringency and mobility. Each diamond shows an EU country. Lighter shades result from overlapping diamonds.The lines shows the GDP-weighted EU averages. Data were collected on 23 November.
These indicators help assess economic activity using relatively simple econometric specifications. We base our assessments on pooled linear regressions of economic activity (industrial production or service sector turnover) in EU members on visits to places of work and on a composite indicator of policy stringency ( Table A.1). The policy stringency indicator is an average of the extent to which workplaces, schools and public transport are closed, the stringency of stay-at-home requirements and restrictions on movement within the country. The regressions are weighted by active population and contain country fixed effects.
Assessments based on these indicators suggest that EU GDP declined by about 1-2% in October and 5-6% in November. Industrial production and service sector turnover, used here as monthly proxies for GDP, move closely in line with the policy index ( Figure A.2, dark blue and red lines). Our forecasts suggest that by November, the start of the second wave had undone most of the recovery witnessed since May ( Figure A.2, light blue and red lines). Google’s mobility indicator points in the same direction but suggests a somewhat smaller decline in activity. Given that a substantial relaxation of policies in December seemed unlikely, EU GDP may fall in the fourth quarter by about 3-4% vs. the third quarter, leaving GDP about 7-9% below its pre-crisis level.
Figure A.2
The pandemic’s second wave appears to reverse the summertime recovery
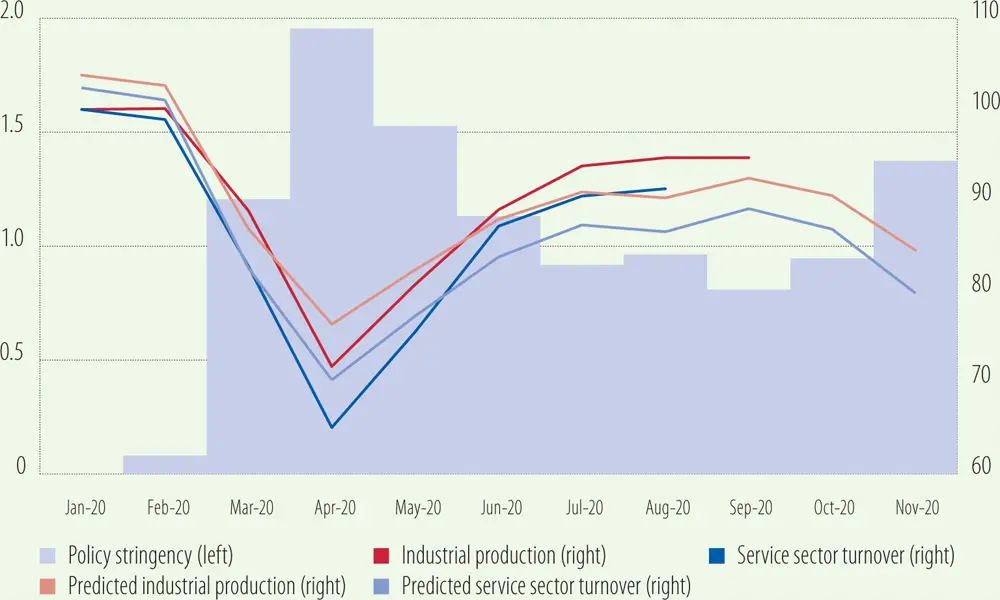
Source: Blavatnik School of Government (2020), Eurostat, and EIB staff calculations.
Note: Forecasts computed using pooled, population-weighted regressions of industrial production and service sector turnover on a work-related subset of Oxford stringency indices and on country fixed effects. Data as of 23 November 2020.
Table A.1
Regression specifications and results
| Dependent variable | Level of industrial production 1 | Level of service sector turnover 1 | ||
| (1) | (2) | (1) | (2) | |
| Impact of a 1 point increase in the policy stringency index | -14.0[-16.0, -11.0] | -16.5[-20.6, -12.2] | ||
| Impact of a 1 point increase in mobility | 0.64[.55, .73] | 0.7[.61, .79] | ||
| R2 | 73.5% | 74% | 84% | 89% |
| N | 223 | 199 | 80 | 55 |
Source: EIB staff calculations.
Читать дальшеИнтервал:
Закладка:
Похожие книги на «EIB Investment Report 2020/2021»
Представляем Вашему вниманию похожие книги на «EIB Investment Report 2020/2021» списком для выбора. Мы отобрали схожую по названию и смыслу литературу в надежде предоставить читателям больше вариантов отыскать новые, интересные, ещё непрочитанные произведения.


Обсуждение, отзывы о книге «EIB Investment Report 2020/2021» и просто собственные мнения читателей. Оставьте ваши комментарии, напишите, что Вы думаете о произведении, его смысле или главных героях. Укажите что конкретно понравилось, а что нет, и почему Вы так считаете.