Malcolm L. Hunter - Fundamentals of Conservation Biology
Здесь есть возможность читать онлайн «Malcolm L. Hunter - Fundamentals of Conservation Biology» — ознакомительный отрывок электронной книги совершенно бесплатно, а после прочтения отрывка купить полную версию. В некоторых случаях можно слушать аудио, скачать через торрент в формате fb2 и присутствует краткое содержание. Жанр: unrecognised, на английском языке. Описание произведения, (предисловие) а так же отзывы посетителей доступны на портале библиотеки ЛибКат.
- Название:Fundamentals of Conservation Biology
- Автор:
- Жанр:
- Год:неизвестен
- ISBN:нет данных
- Рейтинг книги:3 / 5. Голосов: 1
-
Избранное:Добавить в избранное
- Отзывы:
-
Ваша оценка:
Fundamentals of Conservation Biology: краткое содержание, описание и аннотация
Предлагаем к чтению аннотацию, описание, краткое содержание или предисловие (зависит от того, что написал сам автор книги «Fundamentals of Conservation Biology»). Если вы не нашли необходимую информацию о книге — напишите в комментариях, мы постараемся отыскать её.
has been a valued mainstay of the literature, serving both to introduce new students to this ever-changing topic, and to provide an essential resource for academics and researchers working in the discipline. In the decade since the publication of the third edition, concerns about humanity’s efforts to conserve the natural world have only grown deeper, as new threats to biodiversity continue to emerge.
This fourth edition has taken into account a vast new literature, and boasts nearly a thousand new references as a result. By embracing new theory and practice and documenting many examples of both conservation successes and the hard lessons of real-world “wicked” environmental problems,
remains a vital resource for biologists, conservationists, ecologists, environmentalists, and others.
Fundamentals of Conservation Biology — читать онлайн ознакомительный отрывок
Ниже представлен текст книги, разбитый по страницам. Система сохранения места последней прочитанной страницы, позволяет с удобством читать онлайн бесплатно книгу «Fundamentals of Conservation Biology», без необходимости каждый раз заново искать на чём Вы остановились. Поставьте закладку, и сможете в любой момент перейти на страницу, на которой закончили чтение.
Интервал:
Закладка:
The first step in measuring biodiversity is to determine which elements of biodiversity are present in the area of interest. Ideally, we would have a complete inventory, including genes, species, and ecosystems. In practice, logistical constraints commonly limit us to a partial list of species, often listing only vertebrates and perhaps vascular plants and a few large invertebrates. (Sometimes a list of ecosystems is compiled, although the basis for distinguishing among the different types is often unclear; we will focus on the species level of biodiversity here for simplicity.) Lists can be tallied to provide a crude index of biodiversity. In Table 2.1, for example, ecosystem A is easily recognized as more diverse than B or C because it has four species instead of three. This characteristic is called species richness or just richness, and it is a simple, commonly used measure of diversity.
Table 2.1 Hypothetical lists of species for three ecosystems.
| Ecosystem A | Ecosystem B | Ecosystem C |
|---|---|---|
| Black oak | Black oak | Black oak |
| White pine | White pine | White pine |
| Red maple | Red maple | Red maple |
| Yellow birch |
Ecologists also recognize a second component of species diversity called evenness , which is based on the relative abundance of different species. In Table 2.2ecosystem C is more diverse than B because in C the three species have similar levels of abundance, or high evenness. The concept of evenness is not as intuitively obvious as the idea of richness. It may help to think of a jury that has five women and five men versus one that has eight women and two men; the five plus five jury is more diverse because it is more even. Note that no ecosystem ever has perfect evenness; typically there are some common species and many more uncommon species. Concern arises when uncommon species become even rarer, potentially to the point of local extinction.
Table 2.2 Abundance of species (number/hectare) in three ecosystems and measures of richness, evenness,and the Shannon diversity index ( H ), one of many ways to combine richness and evenness quantitatively. (Magurran 2004)
| Ecosystem | A | B | C |
|---|---|---|---|
| Black oak | 40 | 120 | 80 |
| White pine | 30 | 60 | 60 |
| Red maple | 20 | 20 | 60 |
| Yellow birch | 10 | ||
| Richness | 4 | 3 | 3 |
| Evenness | 0.92 | 0.88 | 0.99 |
| H | 0.56 | 0.39 | 0.47 |
H = −∑ p ilog p i, where p iis a measure of the importance of the i th species.
Evenness = H/H maxwhere H maxis the maximum possible value of H .
The ecological importance of species richness seems quite evident, especially if you consider the loss of richness through extinction. Similarly, most conservation biologists would be concerned about any process that reduced evenness, because this would mean uncommon species are becoming less common, while common species are becoming more common. To return to our jury metaphor, this would be analogous to losing a man from the jury that only had two men. Richness and evenness are often combined into a single index of diversity using mathematical formulae ( Table 2.2) but, as we will see in the next sections, such indices are of limited utility.
The Mismeasure of Biodiversity
Often, being precise and quantitative will reveal solutions to a difficult problem, but using quantitative indices of diversity can be misleading when maintaining biodiversity is the goal. Consider the following three lists of species, each one representing (in very abbreviated form) a sample of the species found in three different types of ecosystems.
| Forest | Marsh | Grassland |
| Black oak | Reed‐grass | White prairie‐clover |
| American toad | Painted turtle | Horned lark |
| Eastern racer | Red‐winged blackbird | Black‐footed ferret |
| Scarlet tanager | Muskrat | |
| Raccoon |
If someone were asked which of these tracts is most important from the perspective of maintaining biodiversity, one measure of biodiversity – species richness – would suggest that the forest be chosen. However, if you knew that the black‐footed ferret is one of the rarest mammals in the world and that all the other species listed are very common, you might well select the grassland tract. Why?
The simple answer is that all species may count the same when tallying species richness, but conservationists almost always consider additional information such as the likelihood of a species becoming extinct, its role in an ecosystem, and more. Consequently, not all species are equal from a conservation perspective. We will return to this issue in other chapters, but we need to build a foundation here by considering how conservation decisions are shaped by patterns of diversity and risk of extinction at different spatial scales.
Biodiversity and Spatial Scales
Extinction usually refers to the disappearance of a species from the Earth, but the term is also routinely used, with modifiers, to describe the disappearance of a species from a smaller area. For example, when a species disappears from a small area, this is called a local extinction, even though the area may later be recolonized by immigrants, e.g. when beavers return to a valley from which they had disappeared. On a somewhat larger scale one can refer to regional extinction . For example, during the last century the bald eagle went extinct in many regions of the United States while remaining abundant in Alaska. Although conservation biologists are most concerned about global extinctions, smaller‐scale extinctions are also of some concern because they may foreshadow extinctions on a larger scale and because they may represent a loss of genetic diversity. Another key term is endemic, which refers to species found only in a defined geographic area; thus, koalas are endemic to Australia. If a species is found only in a very limited area (e.g. inhabiting only a single small island or lake), it is sometimes called a local endemic . For example, there is a snail known only from the base of a single waterfall in Chittenango, New York – the Chittenango ovate amber snail.
The risks of extinction at different spatial scales are a key consideration when deciding which endangered species are a higher priority. The larger the scale at which an extinction is likely to occur, the more important it is to try to prevent it. For example, the Iberian lynx, a species confined to southern Spain, is a higher priority for Spanish conservationists than the Eurasian lynx, which has a huge range that just reaches northern Spain ( Fig. 2.2).
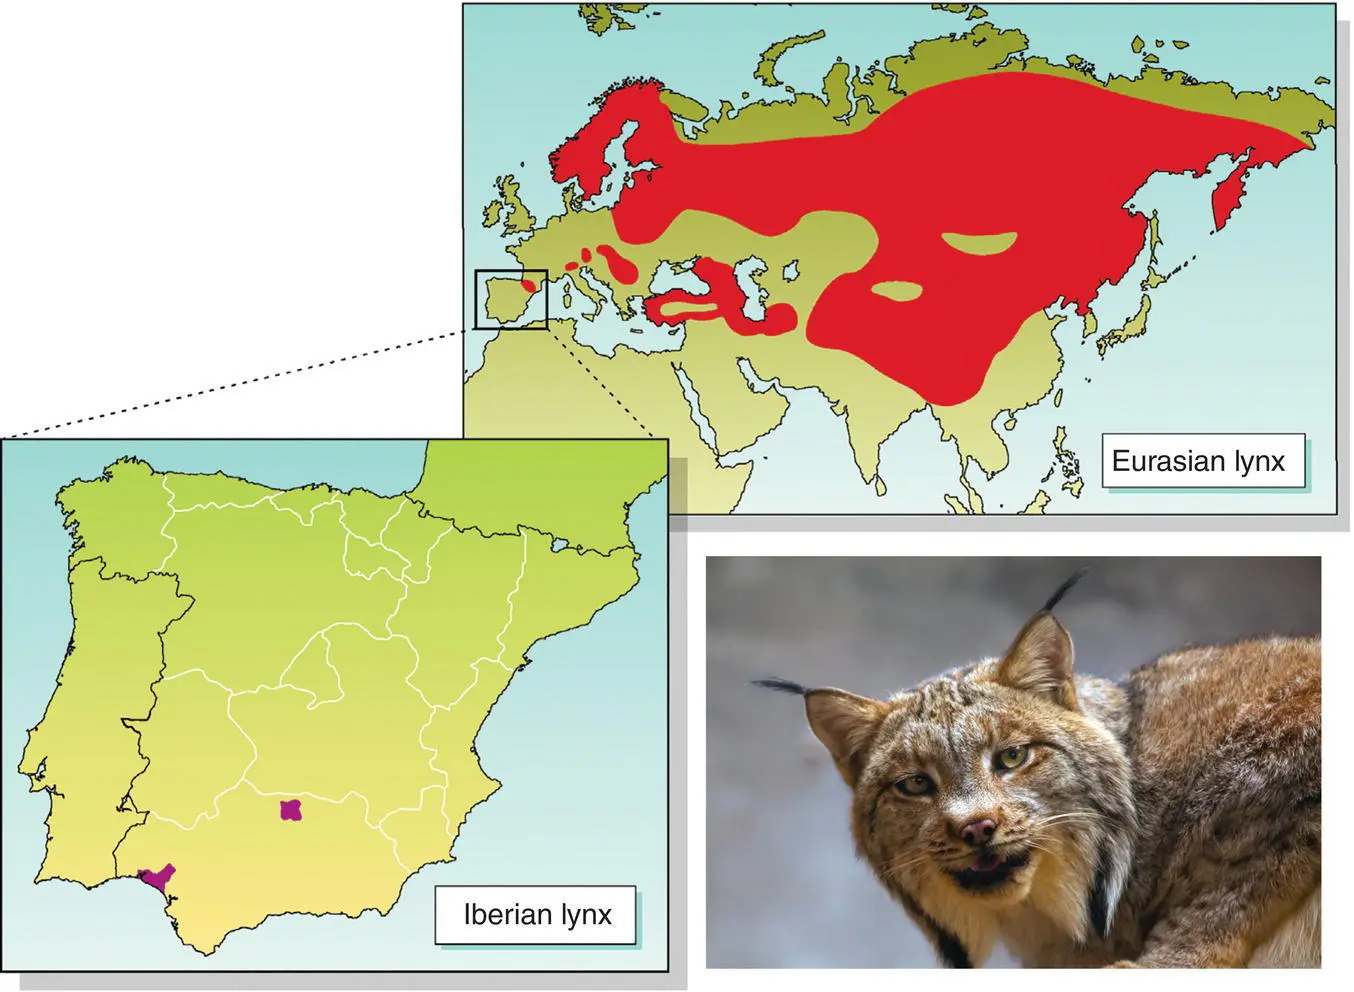
Figure 2.2 Conservationists do not consider all species to merit equal attention. For example, Spanish conservationists place a higher priority on protecting the Iberian lynx, a species now endemic to southern Spain that faces global extinction, than on the Eurasian lynx, a species threatened with regional extinction from the Pyrenees Mountains along the Spanish–French border but still relatively secure in other parts of Europe and Asia.
Читать дальшеИнтервал:
Закладка:
Похожие книги на «Fundamentals of Conservation Biology»
Представляем Вашему вниманию похожие книги на «Fundamentals of Conservation Biology» списком для выбора. Мы отобрали схожую по названию и смыслу литературу в надежде предоставить читателям больше вариантов отыскать новые, интересные, ещё непрочитанные произведения.


Обсуждение, отзывы о книге «Fundamentals of Conservation Biology» и просто собственные мнения читателей. Оставьте ваши комментарии, напишите, что Вы думаете о произведении, его смысле или главных героях. Укажите что конкретно понравилось, а что нет, и почему Вы так считаете.