Digital Teaching and Learning - Perspectives for English Language Education
Здесь есть возможность читать онлайн «Digital Teaching and Learning - Perspectives for English Language Education» — ознакомительный отрывок электронной книги совершенно бесплатно, а после прочтения отрывка купить полную версию. В некоторых случаях можно слушать аудио, скачать через торрент в формате fb2 и присутствует краткое содержание. Жанр: unrecognised, на английском языке. Описание произведения, (предисловие) а так же отзывы посетителей доступны на портале библиотеки ЛибКат.

- Название:Digital Teaching and Learning: Perspectives for English Language Education
- Автор:
- Жанр:
- Год:неизвестен
- ISBN:нет данных
- Рейтинг книги:4 / 5. Голосов: 1
-
Избранное:Добавить в избранное
- Отзывы:
-
Ваша оценка:
Digital Teaching and Learning: Perspectives for English Language Education: краткое содержание, описание и аннотация
Предлагаем к чтению аннотацию, описание, краткое содержание или предисловие (зависит от того, что написал сам автор книги «Digital Teaching and Learning: Perspectives for English Language Education»). Если вы не нашли необходимую информацию о книге — напишите в комментариях, мы постараемся отыскать её.
Digital Teaching and Learning: Perspectives for English Language Education — читать онлайн ознакомительный отрывок
Ниже представлен текст книги, разбитый по страницам. Система сохранения места последней прочитанной страницы, позволяет с удобством читать онлайн бесплатно книгу «Digital Teaching and Learning: Perspectives for English Language Education», без необходимости каждый раз заново искать на чём Вы остановились. Поставьте закладку, и сможете в любой момент перейти на страницу, на которой закончили чтение.
Интервал:
Закладка:
w33. Digital technologies can help communication between the students and myself both in and out of the classroom.
w37. Digital technologies must be used in current English learning and teaching.
w38. I think digital technologies can help form better assessments.
w43. I think digital technologies are appropriate for many English learning activities.
Attitudes toward the Influence of Digital Technologies on Students
w26. I think digital technologies can motivate students.
w31. I think digital technologies can satisfy students’ diverse needs.
w39. Digital technologies can improve learner autonomy.
w42. I think digital technologies are useful for students’ English learning.
Willingness to Use
w29. I think I will keep up with the new developments in digital technologies.
w30. I am willing to improve my skills in using digital technologies.
w41. I think digital technologies have greatly improved my learning and teaching and will continue to do so in the future.
w24. I should improve my digital competence in order to improve my future students’ digital competence.
w35. I think I can become a better English teacher with the help of digital technologies.
 How positive are your digital attitudes?
After going through the questionnaire items of digital attitudes above, reflect for yourself: Are you confident and comfortable using digital technologies? If not, why? What are your concerns and worries regarding the use of digital technologies in teaching and learning?
3.4 Results of the Study
framework for data analysisTo test the three research questions (RQ), we first established a framework as the guideline for data analysis (Figure 2) and then the data analysis was conducted with the help of an online SPSS website www.spssau.comoffering a ‘Statistical Package for the Social Sciences’(cf. Grum & Zydatiß 2016).
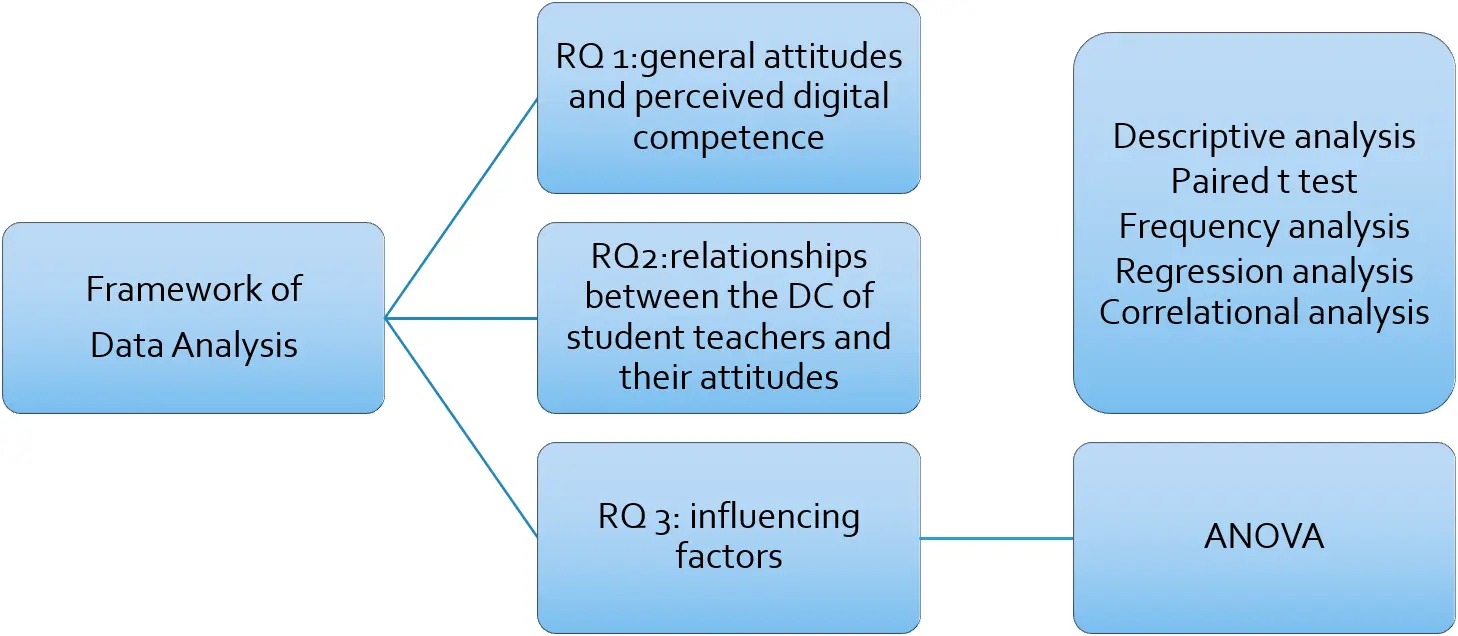 Figure 2:
Framework for the data analysis
The reliability analysis showed that the value of Cronbach α was 0.908, which meant the internal consistency of the questionnaire is excellent and the data could be used for further analysis. We used both parametric and non-parametric analyses. Usually, parametric analyses are adopted when the data are normally distributed and non-parametric analyses do not require the normal distribution. A normal distribution has a symmetric bell shape with equal mean and median located on the center of the distribution. Although the normality test showed that all data collected in this survey did not follow a normal distribution, parametric tests are “sufficiently robust to yield largely unbiased answers that are acceptably close to ‘the truth’ when analyzing Likert scale responses” (Sullivan and Artino, 2013).
 Cronbach’s Alpha: the most commonly used reliability analysis
It is important to “calculate and report Cronbach’s alpha coefficient for internal consistency reliability for any scales or subscales one may be using” (Gliem and Gliem, 2003). The rules of thumb provided by George and Mallery (2003) indicate that a Cronbach’s α value above 0.70 was considered as the threshold to test for internal consistency.
| Cronbach’s alpha | Internal consistency |
| α ≥ 0.9 | Excellent |
| 0.9 > α ≥ 0.8 | Good |
| 0.8 > α ≥ 0.7 | Acceptable |
| 0.7 > α ≥ 0.6 | Questionable |
| 0.6 > α ≥ 0.5 | Poor |
| 0.5 > α | Unacceptable |
(Source: https://www.statisticshowto.com/cronbachs-alpha-spss/)
RQ1: attitudes and self-perception of digital competenceRQ 1 sought to ask about the student teachers’ general attitudes toward digital technologies and their self-perceptions of their digital competences. We created two new variables by grouping the 44 items in the first two sections and conducted a descriptive analysis. The results (Table 1) revealed that the average score for their perceived digital competences was 2.630 and the mean for their digital attitudes was 2.375, both of which were below 3 (between “2-mostly agree” and “3- slightly agree”). The student teachers’ digital attitudes were more positive than their digital competences perceived by them, and the difference was significant as the results of the paired t-test analysis show in Table 2. A t-test is a statistical test for hypothesis testing which shows how significant the differences between the means of two groups are. The significance could be told from the P-value, with P < 0.05 being statistically significant and P<0.001 highly significant. In this case, the two groups refer to the two variables: attitudes toward digital technologies and self-perceptions of digital competences.
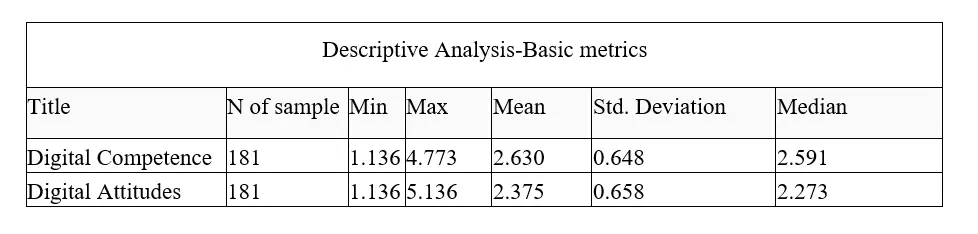 Table 1:
Descriptive analysis on digital competence and attitudes
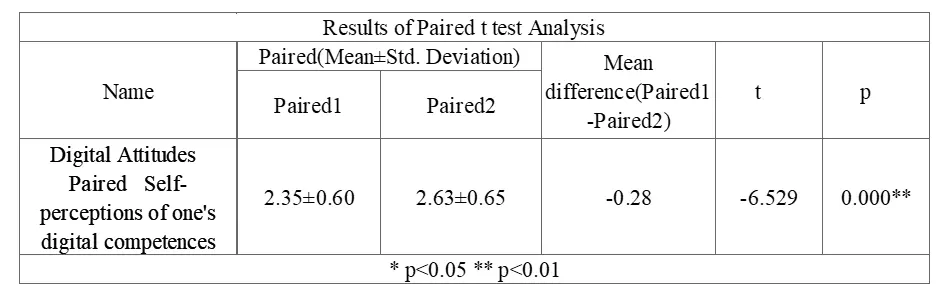 Table 2:
Paired t test analysis on digital competence and attitude
Sullivan and Artino (2013) argued that means are often of little value when data do not follow a classic normal distribution and in this case a frequency distribution of responses will likely be more helpful. The results of the frequency analysis in Figure 3 reveal that 90 % of student teachers had positive attitudes toward DT (34.8%+55.2%) and 75.7% of them had positive self-perceptions of their digital competences (18.2%+57.5%).
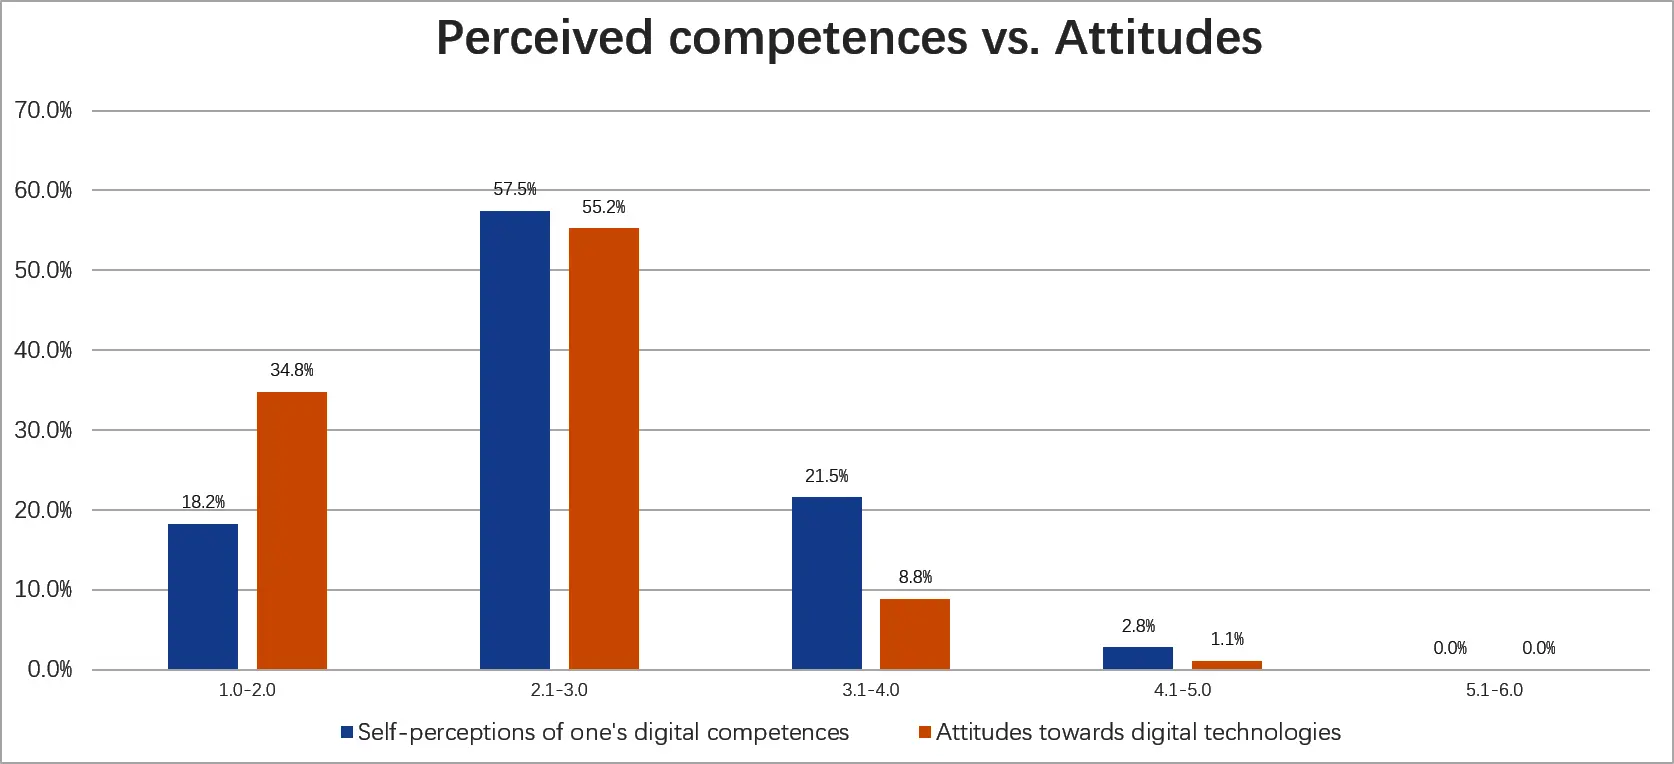 Figure 3:
Frequency analysis of perceived competences and digital attitudes
Figure 4 shows a more detailed distribution of responses concerning the constructs within digital competences. Nearly 90 % of the student teachers (57%+29%) were confident in their competence of using digital technologies to promote their professional engagement, the highest among all six constructs. Over 80 % of them agreed that they could use digital technologies to facilitate learners’ digital competence (39%+44%) and enhance teaching and learning (35%+46%). 76 % of them thought they could use digital technologies in the assessment of learners. But when it comes to digital resources, the number of participants who had positive perceptions dropped to 65 %. The most divided results were about empowering learners, with only 50 % of them perceiving that they were competent in this area.
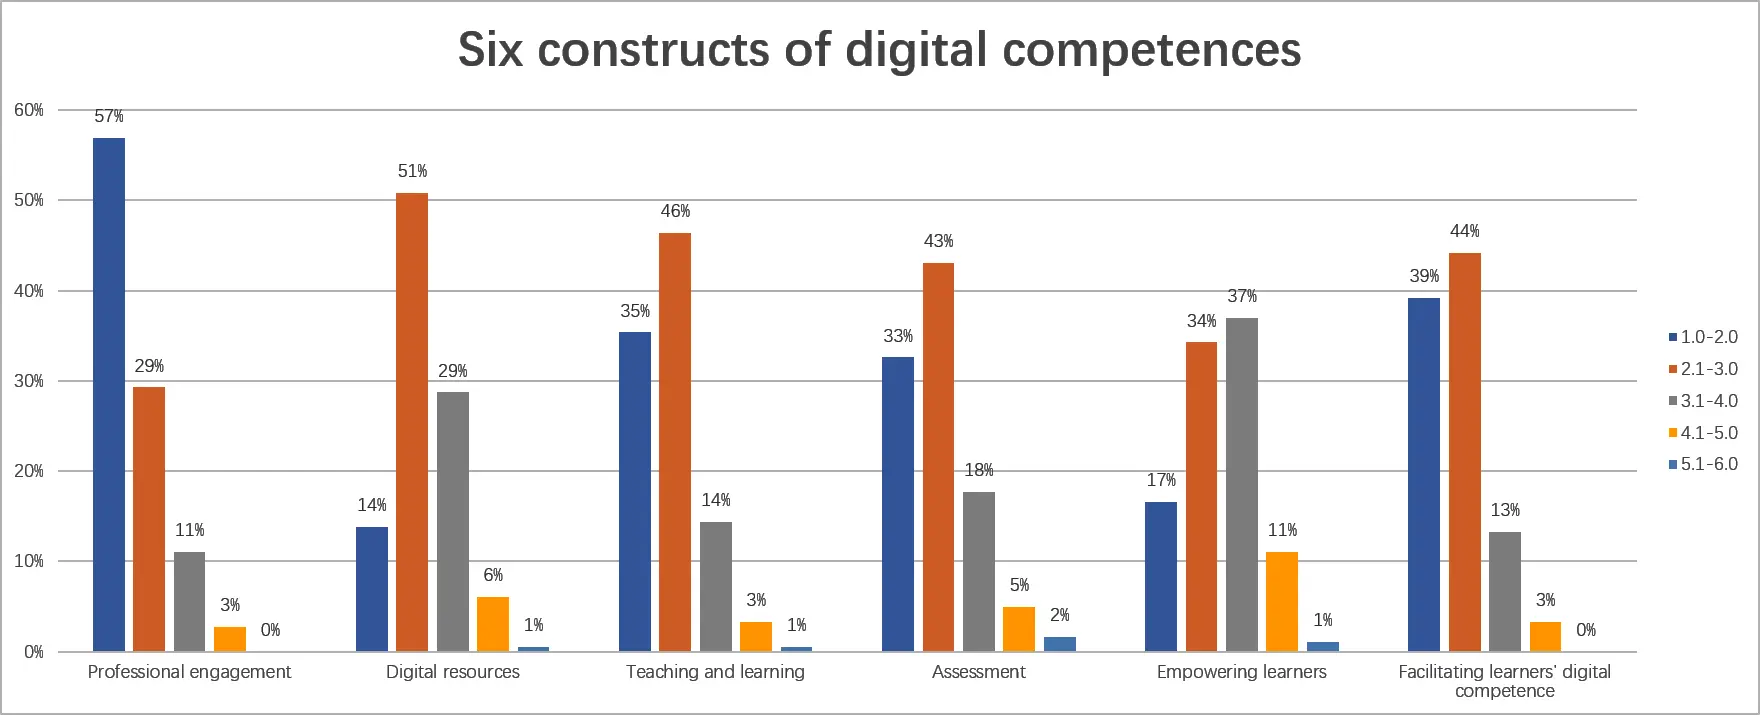 Figure 4:
Frequency analysis of perceived digital competences
The frequency analysis of the four constructs regarding student teachers’ attitudes toward DT (Figure 5) reveals that 94 % of the participants (60%+34%) held positive attitudes toward the influence of DT on students and nearly 93 % of them were willing to use DT in their future classrooms (55%+38%). Yet they seemed to be more skeptical about data privacy and distraction, reflected in the less positive personal feelings toward DT.
Читать дальшеИнтервал:
Закладка:
Похожие книги на «Digital Teaching and Learning: Perspectives for English Language Education»
Представляем Вашему вниманию похожие книги на «Digital Teaching and Learning: Perspectives for English Language Education» списком для выбора. Мы отобрали схожую по названию и смыслу литературу в надежде предоставить читателям больше вариантов отыскать новые, интересные, ещё непрочитанные произведения.


Обсуждение, отзывы о книге «Digital Teaching and Learning: Perspectives for English Language Education» и просто собственные мнения читателей. Оставьте ваши комментарии, напишите, что Вы думаете о произведении, его смысле или главных героях. Укажите что конкретно понравилось, а что нет, и почему Вы так считаете.