Daniel J. Denis - Applied Univariate, Bivariate, and Multivariate Statistics
Здесь есть возможность читать онлайн «Daniel J. Denis - Applied Univariate, Bivariate, and Multivariate Statistics» — ознакомительный отрывок электронной книги совершенно бесплатно, а после прочтения отрывка купить полную версию. В некоторых случаях можно слушать аудио, скачать через торрент в формате fb2 и присутствует краткое содержание. Жанр: unrecognised, на английском языке. Описание произведения, (предисловие) а так же отзывы посетителей доступны на портале библиотеки ЛибКат.

- Название:Applied Univariate, Bivariate, and Multivariate Statistics
- Автор:
- Жанр:
- Год:неизвестен
- ISBN:нет данных
- Рейтинг книги:5 / 5. Голосов: 1
-
Избранное:Добавить в избранное
- Отзывы:
-
Ваша оценка:
Applied Univariate, Bivariate, and Multivariate Statistics: краткое содержание, описание и аннотация
Предлагаем к чтению аннотацию, описание, краткое содержание или предисловие (зависит от того, что написал сам автор книги «Applied Univariate, Bivariate, and Multivariate Statistics»). Если вы не нашли необходимую информацию о книге — напишите в комментариях, мы постараемся отыскать её.
contains an accessible introduction to statistical modeling techniques commonly used in the social and behavioral sciences. The text offers a blend of statistical theory and methodology and reviews both the technical and theoretical aspects of good data analysis.
Featuring applied resources at various levels, the book includes statistical techniques using software packages such as R and SPSS®. To promote a more in-depth interpretation of statistical techniques across the sciences, the book surveys some of the technical arguments underlying formulas and equations. The thoroughly updated edition includes new chapters on nonparametric statistics and multidimensional scaling, and expanded coverage of time series models. The second edition has been designed to be more approachable by minimizing theoretical or technical jargon and maximizing conceptual understanding with easy-to-apply software examples. This important text:
Offers demonstrations of statistical techniques using software packages such as R and SPSS® Contains examples of hypothetical and real data with statistical analyses Provides historical and philosophical insights into many of the techniques used in modern social science Includes a companion website that includes further instructional details, additional data sets, solutions to selected exercises, and multiple programming options Written for students of social and applied sciences,
offers a text to statistical modeling techniques used in social and behavioral sciences.
Applied Univariate, Bivariate, and Multivariate Statistics — читать онлайн ознакомительный отрывок
Ниже представлен текст книги, разбитый по страницам. Система сохранения места последней прочитанной страницы, позволяет с удобством читать онлайн бесплатно книгу «Applied Univariate, Bivariate, and Multivariate Statistics», без необходимости каждый раз заново искать на чём Вы остановились. Поставьте закладку, и сможете в любой момент перейти на страницу, на которой закончили чтение.
Интервал:
Закладка:
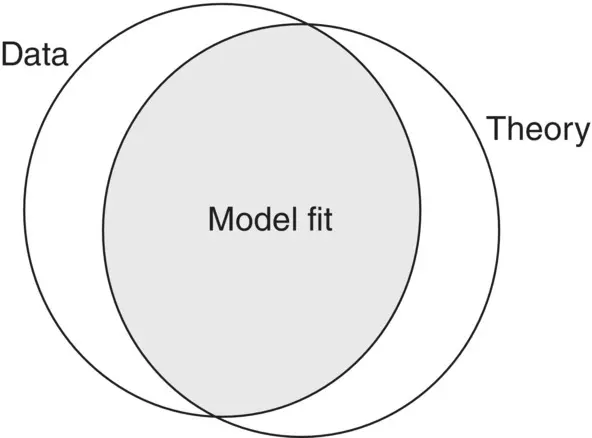
Figure 1.2“Model fit” as an overlap of data with theory.
We must also ensure that our theories are not too convenient of narrativesfit to data. If you have ever witnessed a sporting event where the deciding point occurred by the lucky bounce of a puck in hockey or the breezy push of a tennis ball in midair, only to hear post‐match commentators laud the winning team or individual as suddenly so much better than the losing team, then you know what “convenient narratives” are all about. We must be careful not to exaggerate how well our given theory fits data simply because a few data points went “our way.” George Box once said that all models are wrong but some are useful. In any scientific endeavor, guard against falling in love with your theoryor otherwise exaggerating it far beyond what the data suggest. Otherwise, it no longer is a legitimate theory, but rather is simply your brandand more a product of subjective bias and “career‐building” than anything scientific. After 20 years of advocating a theory, is the researcher you are speaking to really prepared to “accept” evidence that contradicts his or her theory? They have a lot of stakes in that theory, their whole career may have been built upon it, are they really willing to accept “defeat” of it? Indeed, one reason I believe why economic predictions, for instance, are often looked upon with suspicion, is because economists, like psychologists (and theoretical physicists, for that matter), are far too quick to advance theories as though they were near facts. “Sexy theories” sound great and may be marketable to uncritical consumers and media (make an outlandish claim on cable, you'll be a hero!), but to good scientists, theories are always only as good as the data that exist to support them. Science is exciting, to be sure, but should not be overly speculative. If you are looking for fireworks, then you are best to choose a field other than science.
1.2 WHAT IS A “MODEL”?
The word “model” is perhaps the most popular word featured in textbooks, tutorials, and lectures having anything to do with the application of quantitative methods. Attempting to define just what isa model in statistics can be a bit challenging. We discuss the concept by referring to Everitt's definition:
A description of the assumed structure of a set of observations that can range from a fairly imprecise verbal account to, more usually, a formalized mathematical expression of the process assumed to have generated the observed data. The purpose of such a description is to aid in understanding the data.
(Everitt, 2002, p. 247)
Models, are, essentially, and perhaps somewhat crudely, equations. They are equations fit to data that attempt to account for how the data came about or were generatedin the first place. For example, if for every hour a student studied for an exam corresponded to exactly a 1‐point increase in a student's grade, the model that would best explain how this data was generated would be a linear model. Even if the relationship between hours studied and student grade was not perfect, a perfect line might still be the “best” summary. Models are often used to account for messy or imperfect data.
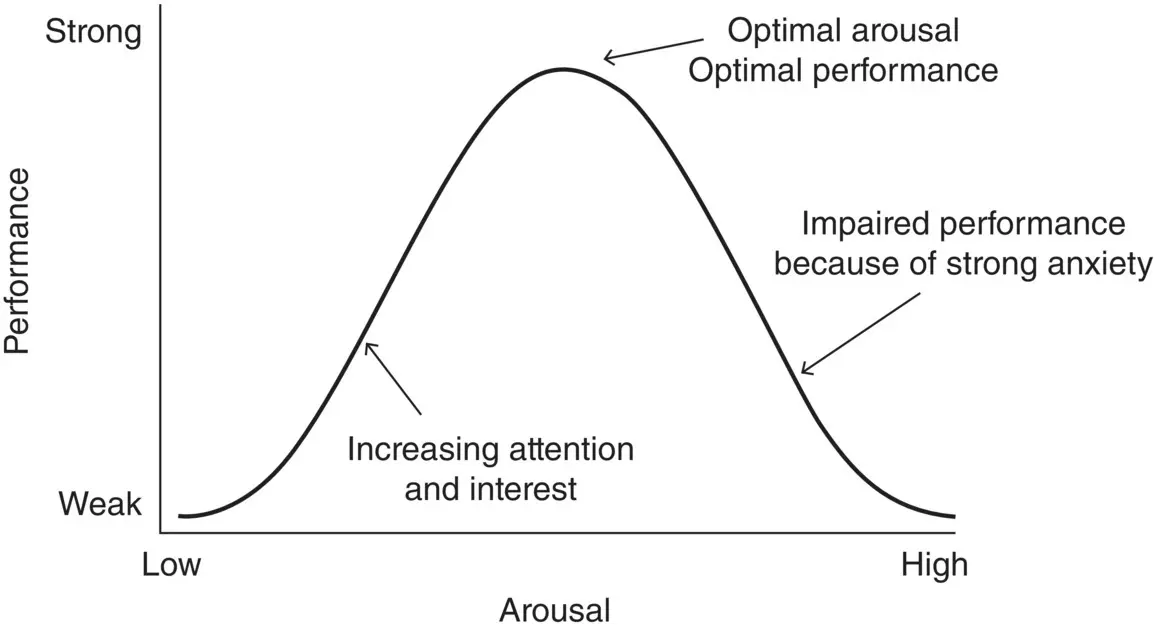
Figure 1.3Hebbian Yerkes–Dodson performance–arousal curve.
Source: Diamond et al. (2007). Licensed under CC by 3.0.
Another example of a model is the classic Hebbian version of the Yerkes–Dodsoncurve expressing the relationship between performance and arousal, depicted in Figure 1.3.
The curve is an inverted “U” shape (an approximate parabola) that provides a useful model relating these two attributes (i.e., performance and arousal). If one exhibits very low arousal, performance will be minimal. If one exhibits a very high degree of arousal, performance will likely also suffer. However, if one exhibits a moderate range of arousal, performance will likely be optimal. The model in this case, as in most cases, does not account for allthe data one might collect. The extent to which it accounts for mostof the data is the extent to which the model may be, in general, deemed “useful.” The use of a model is also enhanced if it can make accurate predictions of future behavior.
As another example of a model, consider the number of O‐ring incidents on NASA's space shuttle (the fleet is officially, and sadly, retired now) as a function of temperature ( Figure 1.4). At very low or high temperatures, the number of incidents appears to be elevated. A square function seems to adequately model the relationship. Does it account for all points? No. But nonetheless, it provides a fairly good summary of the available data. Some have argued that had NASA had such a model (i.e., essentially the line joining the points) available before Challengerwas launched on January 28, 1986, the launch may have been delayed and the shuttle and crew saved from disaster. 2 We feature this data in our chapter on logistic regression.
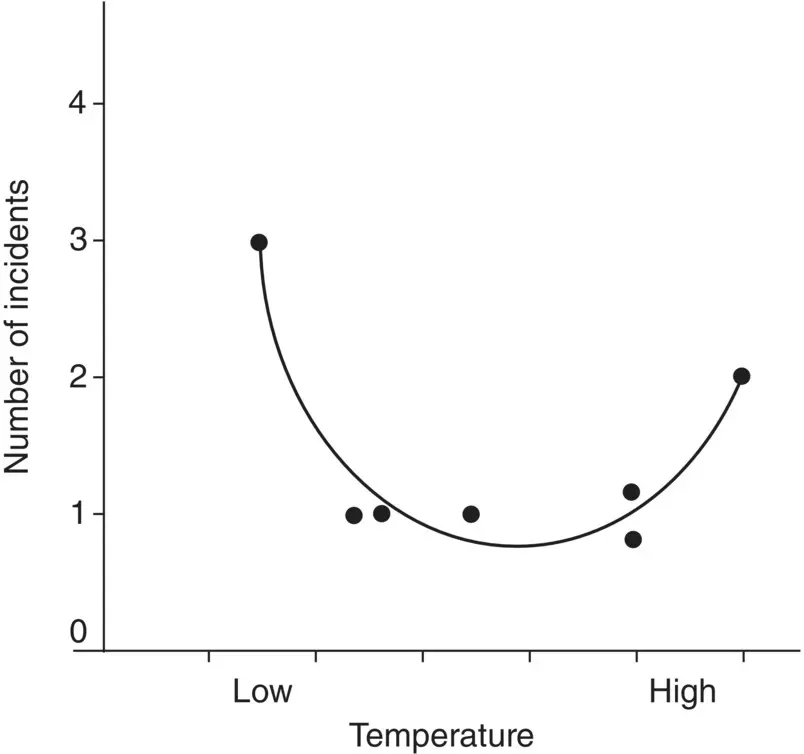
Figure 1.4Number of O‐ring incidents on boosters as a function of temperature.
Why did George Box say that all models are wrong, some are useful? The reason is that even if we obtain a perfectly fitting model, there is nothing to say that this is the onlymodel that will account for the observed data. Some, such as Fox (1997), even encourage divorcing statistical modeling as accounting for deterministic processes. In discussing the determinants of one's income, for instance, Fox remarks:
I believe that a statistical model cannot, and is not literally meant to, capture the social process by which incomes are “determined” … No regression model, not even one including a residual, can reproduce this process … The unfortunate tendency to reify statistical models – to forget that they are descriptive summaries, not literal accounts of social processes – can only serve to discredit quantitative data analysis in the social sciences. (p. 5)
Indeed, psychological theory, for instance, has advanced numerous models of behavior just as biological theory has advanced numerous theories of human functioning. Two or more competing models may each explain observed data quite well. Sometimes, and unfortunately, the model we adopt may have more to do with our sociological (and even political) preferences than anything to do with whether one is more “correct” than the other. Science (and mathematics, for that matter) is a humanactivity, and often theories that are deemed valid or true have much to do with the spirit of the times(the so‐called Zeitgeist) and what the scientific community will actually accept and tolerate as being true. 3 Of course, this is not true in all circumstances, but you should be aware of the factors that make theories popular, especially in fields such as social science where “hard evidence” can be difficult to come by. The reason the experimentis often considered the “gold standard” for evidence is because it often (but not always) helps us narrow down narratives to a few compelling possibilities. In strictly correlational research, isolating the correct narrative can be exceedingly difficult or nearly impossible, despite which narrative we wish upon our datathe most. Good science requires a very critical eye. Whether the theory is that of the Big Bang, the determinants of cancer, or theories of bystander intervention, all of these are narratives to help account for observed data.
Читать дальшеИнтервал:
Закладка:
Похожие книги на «Applied Univariate, Bivariate, and Multivariate Statistics»
Представляем Вашему вниманию похожие книги на «Applied Univariate, Bivariate, and Multivariate Statistics» списком для выбора. Мы отобрали схожую по названию и смыслу литературу в надежде предоставить читателям больше вариантов отыскать новые, интересные, ещё непрочитанные произведения.


Обсуждение, отзывы о книге «Applied Univariate, Bivariate, and Multivariate Statistics» и просто собственные мнения читателей. Оставьте ваши комментарии, напишите, что Вы думаете о произведении, его смысле или главных героях. Укажите что конкретно понравилось, а что нет, и почему Вы так считаете.