1 1. Bossidy R. (2002). Execution: The Discipline of Getting Things Done. Random House.
2 2. Heifetz R. (2002). Leadership on the Line: Staying Alive through the Dangers of Leading. Harvard Business Review Press.
3 3. Katzenbach R. (1993). The Discipline of Teams. Harvard Business Review Press.
PART IV THE THIRD “R”: THE RIGHT PROBLEM
CHAPTER 7 What Is the Scope of the Project? The SIPOC Diagram
YOU NEED TO KNOW YOUR PROJECT’S SCOPE AND BOUNDARIES
What process does the problem relate to? What is the target of the improvement? Where does work begin and end? The process boundaries clearly define the extent of the project scope and serve as an effective way for making decisions about the project activities. The project scope establishes the limits of the project work, defines the inclusions and exclusions, and helps define the expected outcomes of the QI project .
The easiest way for all key stakeholders to agree with the scope and boundaries of your project is to show the beginning and the end of the process that is going to be targeted for improvement. This can be done well with a high‐level process diagram,such as the SIPOC diagram.
THE TOOL: A SIPOC DIAGRAM
What Is a SIPOC Diagram?
SIPOC is an acronym for Suppliers, Inputs, Process, Outputs, and Customers. Although the name originated in the manufacturing industry, the SIPOC diagram has achieved widespread acceptance in healthcare.
The SIPOC diagram shows a process snapshot and captures all the key activities and relevant elements in a process in order to help define the scope and boundaries of a project.
The SIPOC diagram
provides an easy way to visualize the process in its entirety;
presents the process in 4–6 high‐level steps;
visually documents the relationship between suppliers, inputs, outputs, and customers; and
clearly identifies the start and end of the process.
It is critical to understand the startand endof a process because they impact the stakeholders, the criteria used to select who should be involved in the improvement team, and the scope of the project.
Advantages of the SIPOC Diagram
Despite a lack of familiarity with its terminology, most QI teams in healthcare find the SIPOC diagram to be a great tool to define the scope and boundaries of their project. The SIPOC diagram offers numerous benefits:
It provides an easy way to visualize the process in its entirety and to quickly understand the limits of the project. The diagram facilitates an understanding of the flow of the process for all team members.
The team and the Primary Sponsor are better aligned with the scope and boundaries of the project.
Relevant elements that are needed when considering the project scope are quickly captured.
It presents a graphical depiction of the relationship between process inputs and outputs, and between suppliers and customers.
The key stakeholders are delineated. The SIPOC diagram makes clear who needs to be included in project communications.
Discussion is better focused on the key elements of the project.
The SIPOC diagram helps get the Primary Sponsor,QI team members, and key stakeholders on the same page. It also helps prevent scope creep, which is the tendency for ill‐defined project scopes to expand over time, resulting in projects that cannot accomplish the objectives or produce the expected deliverables in the agreed upon time frame.
HOW TO DRAW A SIPOC DIAGRAM
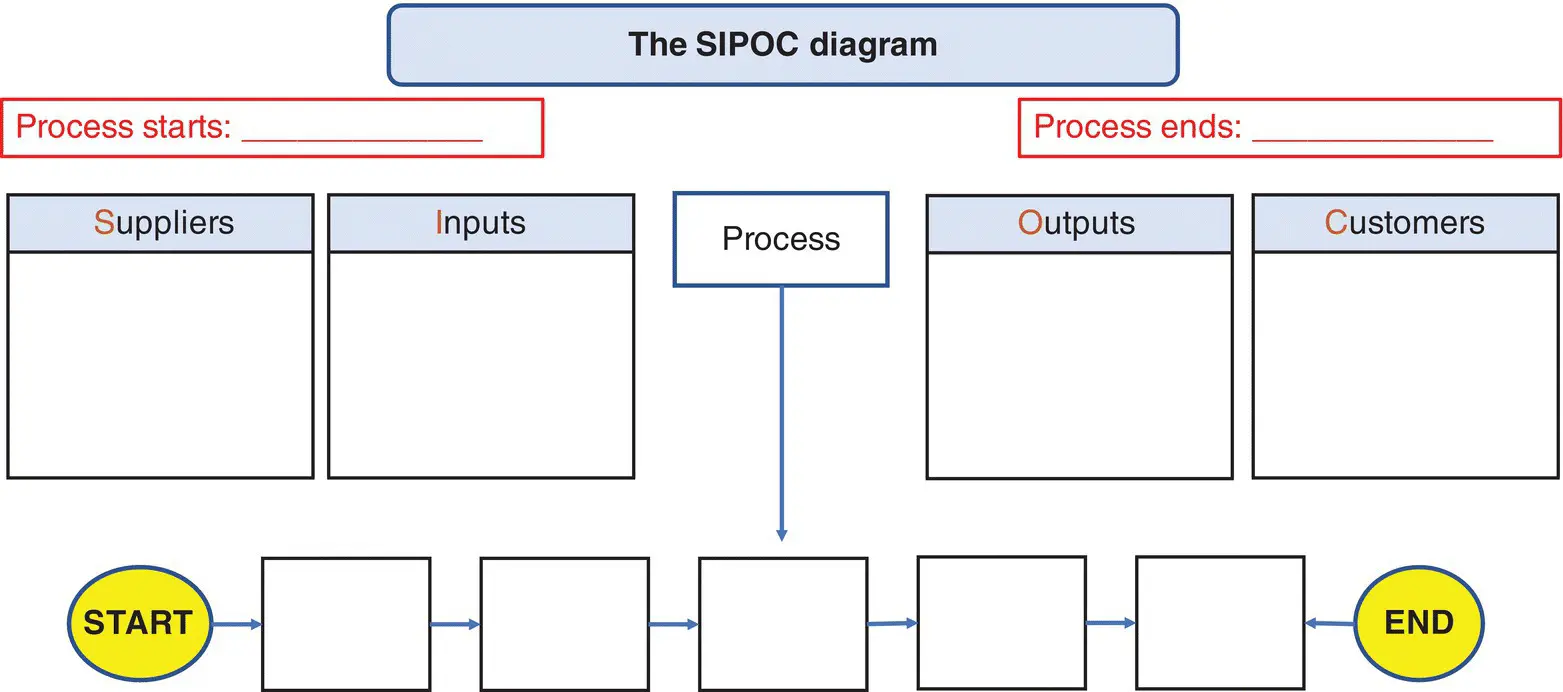
A SIPOC diagram has five distinguishable elements (see Figure 7‐1):
1 A list of suppliers. A supplier is a person, team, or department that provides inputs into the process. Suppliers can be technicians, physicians, nurses, materials management crews, blood bank personnel, or an entire clinical department. Suppliers, in general, do not perform the work. They provide what the “people that do the work” need to perform their duties.
2 A list of inputs. An input is what flows into the process. This can be people, materials, supplies, equipment, information, or data.
3 A list of outputs: An output is the finished product(s) or service(s) from the process or, if more detail is needed, each process step.
4 A list of customers or end users. As we explained in Chapter 3, a customer is the end user who receives the work product or output of the process. The ultimate customer is the patient, but in healthcare, customers can also be other end users such as physicians, nurses, technicians, or other front‐line staff.
5 A high‐level view of the process. These are the 4–6 high‐level steps that are required to achieve the output.

FIGURE 7‐1The SIPOC template.
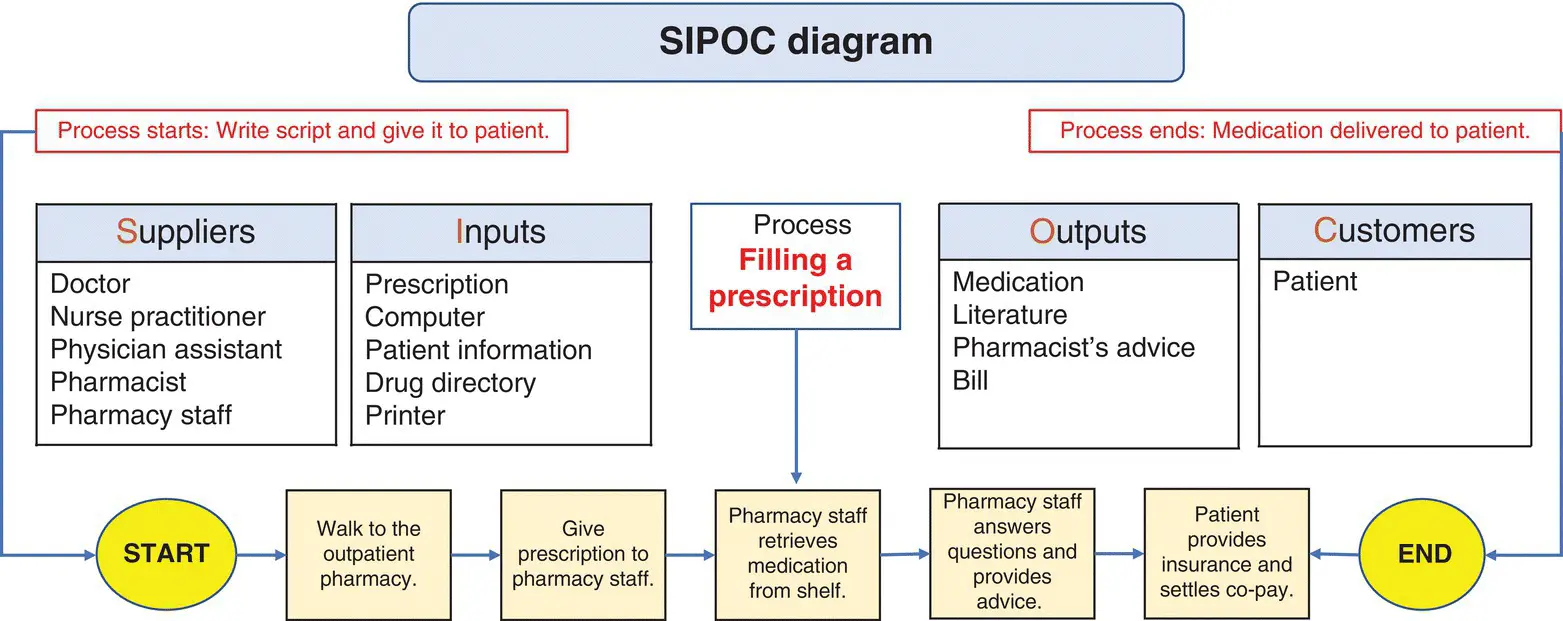
Figure 7‐2presents a completed SIPOC diagram, for the “prescription to medication delivery” process, highlighting the suppliers, inputs, outputs, customers, and the high‐level view map or steps of the process.

FIGURE 7‐2SIPOC diagram for “prescription to medication delivery.”
Steps to Creating a SIPOC Diagram
Identify the process’s beginning and ending steps.
Add the main process steps, selecting a maximum of 4–6 high‐level steps.
Identify the key outputs.
Identify customers in the downstream steps, while focusing on the critical few.
Identify the key inputs and suppliers in the upstream steps.
Identify the critical to quality requirements for each input, process steps, and outputs.
Example: SIPOC Diagram for St. Barnabas’ Preoperative Evaluation Clinic
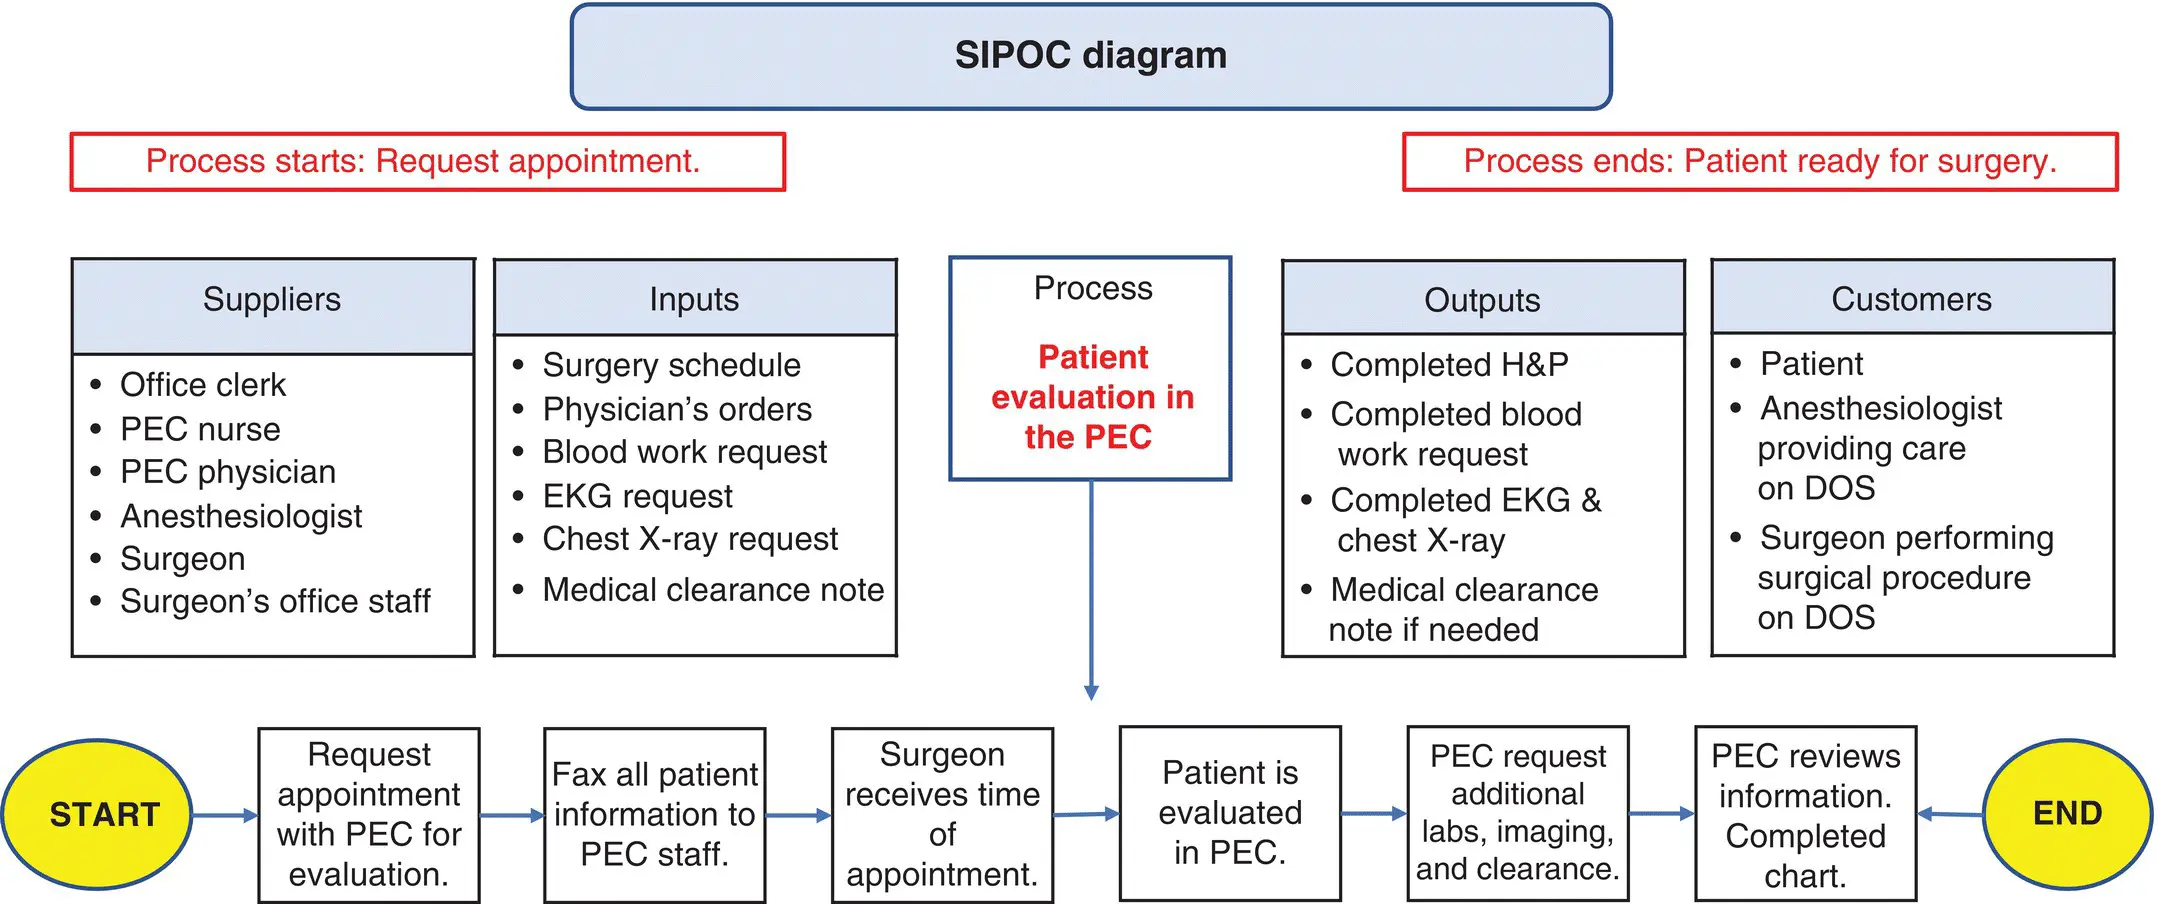
The Preoperative Evaluation Clinic (PEC) at St. Barnabas Medical Center is staffed with three physician assistants (PAs) and one full‐time anesthesiologist. At a recent meeting of the Surgical Services, a number of surgeons complained about the performance of the clinic, specifically, about delays in getting patients scheduled and a high cancellation rate on the day of surgery (DOS). Cancellations negatively affect the OR throughput, surgeon’s satisfaction, and the “bottom line” for the organization. The chair of Anesthesiology decided to launch a QI project. The goal of the project was to improve efficiency by reducing the number of cancellations on the day of surgery that are due to incomplete preoperative workup. After writing a Problem Statement, and drafting their first Project Charter, the QI team decided to set the project scope and boundaries creating a SIPOC diagram (see Figure 7‐3).

FIGURE 7‐3A SIPOC diagram for “patient evaluation in the PEC clinic.”
CHAPTER 8 Who Are the “Customers,” and What Do They Need?
IN HEALTHCARE, WE ALSO HAVE “CUSTOMERS”
Who Is the “Customer”?
Improving the quality of care requires a meaningful and actionable strategy and a well‐organized approach. The appropriateness of the strategy, and the effectiveness of the approach, depend on a clear understanding of the problem from the customer’s perspective. To clearly understand the problem we should “walk a mile in the customer’s shoes.” So, who is the customer?
Читать дальше


