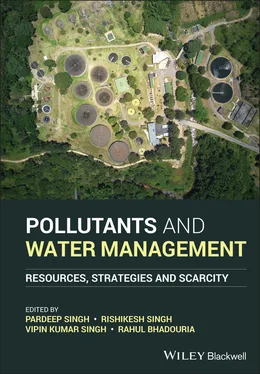
Pollutants and Water Management
Здесь есть возможность читать онлайн «Pollutants and Water Management» — ознакомительный отрывок электронной книги совершенно бесплатно, а после прочтения отрывка купить полную версию. В некоторых случаях можно слушать аудио, скачать через торрент в формате fb2 и присутствует краткое содержание. Жанр: unrecognised, на английском языке. Описание произведения, (предисловие) а так же отзывы посетителей доступны на портале библиотеки ЛибКат.
- Название:Pollutants and Water Management
- Автор:
- Жанр:
- Год:неизвестен
- ISBN:нет данных
- Рейтинг книги:3 / 5. Голосов: 1
-
Избранное:Добавить в избранное
- Отзывы:
-
Ваша оценка:
- 60
- 1
- 2
- 3
- 4
- 5
Pollutants and Water Management: краткое содержание, описание и аннотация
Предлагаем к чтению аннотацию, описание, краткое содержание или предисловие (зависит от того, что написал сам автор книги «Pollutants and Water Management»). Если вы не нашли необходимую информацию о книге — напишите в комментариях, мы постараемся отыскать её.
WATER MANAGEMENT Pollutants and Water Management: Resources, Strategies and Scarcity
Pollutants and Water Management
Pollutants and Water Management: Resources, Strategies and Scarcity
Pollutants and Water Management — читать онлайн ознакомительный отрывок
Ниже представлен текст книги, разбитый по страницам. Система сохранения места последней прочитанной страницы, позволяет с удобством читать онлайн бесплатно книгу «Pollutants and Water Management», без необходимости каждый раз заново искать на чём Вы остановились. Поставьте закладку, и сможете в любой момент перейти на страницу, на которой закончили чтение.
Интервал:
Закладка:
The achievement of water security in the future will be a very challenging task. This chapter describes in detail the current situation and future challenges regarding water security along with prospective health changes. Further, the impact of climate change on water security and health has been analyzed. The available opportunities are also discussed to manage future challenges related to water security.
1.2 Quantity of Available Water Resources in India
The annual precipitation (rainfall+snowfall) is estimated as 4000 billion cubic meters (BCM). Out of total annual precipitation, 3000 BCM falls during the monsoon season (Jun to September) (Central Water Commission 2014). Around 53.3% of total annual precipitation is lost due to evapotranspiration, which leaves a balance of 1986.5 BCM. The total annual utilizable water resources of India are 1123 BCM, which consists of 690 BCM surface water and 433 BCM of groundwater (Central Water Commission 2014). The National Commission on Integrated Water Resources Development (NCIWRD) projected that total water demand to expect 973 (low demand scenario) to 1180 BCM (high demand scenario). The water used for agriculture is the highest projected demand (70%), followed by households (23%) and industries (7%) (NCIWRD 1999). The per capita average water availability in India in the year 2001 was 1816 m 3, and it is expected to reduce to 1140 m 3in 2050 (MoWR 2015). The people of the Indian state of Andhra Pradesh have the highest access to safe treated water, i.e., 36%, and it is lowest for Bihar (2%) (Forbes India 2015). The annual surface water availability of India has decreased since the year 1950 ( Table 1.1).
Rivers are the primary sources of surface water in India and are considered as the lifeline of Indian cities. There are 15 large, 45 medium, and 120 minor rivers in India (Raj 2010). The rivers are either rainfed and/or based on the Himalayan glacier. The annual water potential in the major river basins of India is 1869.35 BCM, but the utilizable potential is 690 BCM. The Ganga basin has the highest utilizable potential, i.e., 250 BCM. The detailed account of surface water potential of Indian rivers is depicted in Table 1.2.
Table 1.1 Annual surface water availability of India.
Source: Govt. of India (2009).
| S. no | Year | Annual surface water availability (m 3/capita/year) |
|---|---|---|
| 1 | 1951 | 5177 |
| 2 | 1991 | 2209 |
| 3 | 2001 | 1820 |
| 4 | 2025 | 1341 |
| 5 | 2050 | 1140 |
Table 1.2 Overview of surface water potential of Indian rivers.
Source: Central Water Commission, http://cwc.gov.in/water‐info.
| S. no | River basin | Catchment area (sq km) | Average water resources potential (BCM) | Utilizable surface water resources (BCM) |
|---|---|---|---|---|
| 1 | Indus (up to border) | 321 289 | 73.31 | 46 |
| 2 | (a) Ganga | 861 452 | 525.02 | 250 |
| (b) Brahmaputra | 194 413 | 537.24 | 24 | |
| (c) Barak and others | 41 723 | 48.36 | ||
| 3 | Godavari | 312 812 | 110.54 | 76.3 |
| 4 | Krishna | 268 948 | 78.12 | 58 |
| 5 | Cauvery | 81 155 | 21.36 | 19 |
| 6 | Subarnarekha | 29 196 | 12.37 | 6.8 |
| 7 | Brahmani and Baitarani | 51 822 | 28.48 | 18.3 |
| 8 | Mahanadi | 141 589 | 66.88 | 50 |
| 9 | Pennar | 55 213 | 6.32 | 6.9 |
| 10 | Mahi | 34 842 | 11.02 | 3.1 |
| 11 | Sabarmati | 21 674 | 3.81 | 1.9 |
| 12 | Narmada | 98 796 | 45.64 | 34.5 |
| 13 | Tapi | 65 145 | 14.88 | 14.5 |
| 14 | West flowing rivers from Tapi to Tadri | 55 940 | 87.41 | 11.9 |
| 15 | West flowing rivers from Tadri to Kanyakumari | 56 177 | 113.53 | 24.3 |
| 16 | East flowing rivers between Mahanadi and Pennar | 86 643 | 22.52 | 13.1 |
| 17 | East flowing rivers between Pennar and Kanyakumari | 100 139 | 16.46 | 16.5 |
| 18 | West flowing rivers of Kutch and Saurashtra including Luni | 321 851 | 15.1 | 15 |
| 19 | Area of inland drainage of Rajasthan | 36 202 | 0 | NA |
| 20 | Minor river basins draining into Myanmar and Bangladesh | 31 | NA | |
| Total | 1869.35 | 690 |
India is the largest and fastest consumer of groundwater, which fulfills the demands of nearly 80 and 50% of the rural and urban population, respectively (Shankar et al. 2011). The groundwater resources of the country are estimated to be 433 BCM, which is 39% of the total water resources of India (CGWB 2017). The net groundwater availability is 396 BCM, while the available for potential use is 245 BCM. The stage of groundwater development is 61% (CGWB 2017). The Indian state Uttar Pradesh has the highest net annual groundwater availability (~72 BCM) and Delhi has the least (0.29 BCM) (CGWB 2014). Around 85% of the rural population uses groundwater for drinking purposes. The volume of groundwater is inadequate to fulfill the demand of the large population, agricultural practices, rampant industrialization, and urbanization. The overall account of groundwater resources assessment 2004–2017 is presented in Table 1.3.
The per capita average water availability in India is continuously decreasing. India has a huge potential in river and precipitation water (rainfall+snowfall), but currently, not even 50% of the potential is being used. Due to the lack of use of the water potential of river and precipitation, groundwater resources are under tremendous pressure and the water table is continuously increasing in most parts of the country over time.
Table 1.3 Groundwater resources assessment from 2004–2017.
Source: CGWB (2017).
| Year | Annual replenishable groundwater resources (BCM) | Net annual groundwater availability (BCM) | Annual groundwater draft for irrigation, domestic, and industrial uses (BCM) | Stage of groundwater development |
|---|---|---|---|---|
| 2004 | 433 | 399 | 231 | 58% |
| 2009 | 431 | 396 | 243 | 61% |
| 2011 | 433 | 398 | 245 | 62% |
| 2013 | 447 | 411 | 253 | 62% |
| 2017 | 432 | 393 | 249 | 63% |
1.3 Quality of Available Water Resources in India
Water quality of both available surface and groundwater resources does not satisfy the criteria for potable water in most parts of the country. The Ministry of Jal Shakti report revealed that 70% of water resources in India are polluted by untreated sewage and industrial effluents. The monitoring report of the Central Pollution Control Board (CPCB 2011), based on biological oxygen demand (BOD) and coliform bacteria count, indicated that organic pollution is predominant in aquatic bodies. The groundwater of around 600 districts (i.e. almost one‐third of India) is nonpotable. On the other hand, the Central Groundwater Water Board (CGWB) has reported the presence of contaminants like fluoride, nitrate, arsenic, iron, and other heavy metals in the groundwater of many regions ( Table 1.4). As and F −contamination of groundwater is a significant public health risk concern for Indian people. As and F −contamination of groundwater is a health threat for approximately 100 and 66 million Indian people, respectively (Bindal and Singh 2019; Kadam et al. 2020). Other major groundwater contaminants like U, NO 3 −, Fe, HCO 3 −, etc. have also been reported in several parts of India. High nitrate content in water is another grave concern in many states (Ministry of Water Resources 2014; Kaur et al. 2019). Apart from governmental organizations, various studies/reports on groundwater and surface water quality have confirmed the presence of other contaminants like uranium, cadmium, lead, copper, sulfate, pesticides, and organic pollutant in the water resources of India (Bacquart et al. 2012; Mittal et al. 2014; Chowdhury et al. 2016; Kumar et al. 2016; Bajwa et al. 2017).
Читать дальшеИнтервал:
Закладка:
Похожие книги на «Pollutants and Water Management»
Представляем Вашему вниманию похожие книги на «Pollutants and Water Management» списком для выбора. Мы отобрали схожую по названию и смыслу литературу в надежде предоставить читателям больше вариантов отыскать новые, интересные, ещё непрочитанные произведения.
Обсуждение, отзывы о книге «Pollutants and Water Management» и просто собственные мнения читателей. Оставьте ваши комментарии, напишите, что Вы думаете о произведении, его смысле или главных героях. Укажите что конкретно понравилось, а что нет, и почему Вы так считаете.
