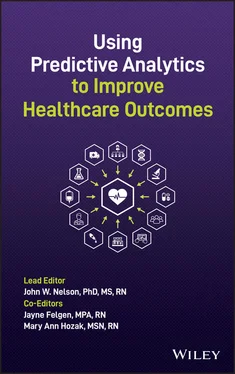
Using Predictive Analytics to Improve Healthcare Outcomes
Здесь есть возможность читать онлайн «Using Predictive Analytics to Improve Healthcare Outcomes» — ознакомительный отрывок электронной книги совершенно бесплатно, а после прочтения отрывка купить полную версию. В некоторых случаях можно слушать аудио, скачать через торрент в формате fb2 и присутствует краткое содержание. Жанр: unrecognised, на английском языке. Описание произведения, (предисловие) а так же отзывы посетителей доступны на портале библиотеки ЛибКат.
- Название:Using Predictive Analytics to Improve Healthcare Outcomes
- Автор:
- Жанр:
- Год:неизвестен
- ISBN:нет данных
- Рейтинг книги:5 / 5. Голосов: 1
-
Избранное:Добавить в избранное
- Отзывы:
-
Ваша оценка:
- 100
- 1
- 2
- 3
- 4
- 5
Using Predictive Analytics to Improve Healthcare Outcomes: краткое содержание, описание и аннотация
Предлагаем к чтению аннотацию, описание, краткое содержание или предисловие (зависит от того, что написал сам автор книги «Using Predictive Analytics to Improve Healthcare Outcomes»). Если вы не нашли необходимую информацию о книге — напишите в комментариях, мы постараемся отыскать её.
Discover a comprehensive overview, from established leaders in the field, of how to use predictive analytics and other analytic methods for healthcare quality improvement. Using Predictive Analytics to Improve Healthcare Outcomes
before
proven in advance
Using Predictive Analytics to Improve Healthcare Outcomes
Using Predictive Analytics to Improve Healthcare Outcomes — читать онлайн ознакомительный отрывок
Ниже представлен текст книги, разбитый по страницам. Система сохранения места последней прочитанной страницы, позволяет с удобством читать онлайн бесплатно книгу «Using Predictive Analytics to Improve Healthcare Outcomes», без необходимости каждый раз заново искать на чём Вы остановились. Поставьте закладку, и сможете в любой момент перейти на страницу, на которой закончили чтение.
Интервал:
Закладка:
Something interesting (and initially alarming) shows up in the data when these “buddies” begin to evolve into good leaders. When leaders become clear in their own roles, they usually realize the importance of helping staff members become clear in their roles, which means, among other things, requiring them to follow policies. Not surprisingly, scores reflecting the staff’s satisfaction with the manager will drop—sometimes precipitously—once the manager begins, after a period of having reliably been a “buddy,” to really lead. What is fascinating, however, is to watch the 10 aspects of job satisfaction for the nurses under this person's supervision that were initially so low, steadily improve. If you understand the data, you realize pretty quickly that the falling score for satisfaction with the manager is not a reflection of the manager's poor performance, but actually a symptom of staff members adjusting to losing a manager who did not adhere to policy. It is common for the data analyst to have to spend some time encouraging managers who initially feel bad when their unit's score for satisfaction with “relationships with the unit manager” falls, especially after they have begun working so hard to be better managers. It can take 2–3 years for staff to adjust to the change when a manager shifts from one who lets people do mostly as they please to one who leads with role clarity and policy enforcement. If not for the presence of an analyst who understands the nuances of such data, the data would be disheartening, and nothing productive would likely come of it. It is the real‐life story the data tells that is of inestimable value.
It is the real‐life story the data tells that is of inestimable value.
Using Data to Bring Objectivity to Sensitive Topics
Sometimes data brings needed clarity to difficult subjects, such as tensions between doctors and nurses. It is not uncommon for nurses and doctors to have stressful relationships. As our data analyst colleague has seen time and again, this is often due to poor role clarity or poor system clarity in the independent, interdependent, and dependent functions of each role. The roles can overlap, and interdependence between nurses and doctors sets them up for tension if they lack role or system clarity in teamwork.
As you can imagine, simply announcing the reality that nurses in an organization or unit have said they are dissatisfied with their relationships with physicians would be counterproductive. When the data is understood in context, however, it can be used to facilitate some very helpful discussions and/or spur people to incorporate relationship‐building opportunities into their action plans. Presenting the data as it relates to commensurate scores in role clarity or system clarity can help facilitate discussions on how people from each profession experience (or would like to experience) teamwork, or to identify where specific tensions exist in clinical care. Such discussions have helped reveal opportunities for resolution.
In an organization in Scotland, when the scores showed strained relationships between nurses and physicians, their solution was to hold retreats where nurses and physicians got together to discuss issues, both professional and personal, in a safe and nurturing atmosphere. It was a relatively small action that yielded noticeable improvement. And, of course, people do not take such actions in order to achieve a better score on a report; it is to have the care that comes with better relationships become standard in the organization.
Without effective leadership, change will not occur. Leaders need to pay attention to what our data analyst colleague calls the “campfire experience”—the sitting‐around‐talking‐excitedly aspect of data—and harness the energy of it. It is important to understand what is going on with the team's excitement. Once that excitement is in place, we can ask more specific questions: Should I be examining effective or ineffective leadership? What could we examine that would be of highest value to the team? What action does the data suggest we should take first?
Without effective leadership, change will not occur.
Effective leadership can help staff members follow their excitement into a strategy.
Effective leadership can help staff members follow their excitement into a strategy.
Leaders Using Data for Inspiration: Story 1
Here is an example of how a unit manager used data to work with staff members to plan for change.
A primary goal of the nurse manager of a neuroscience unit was to create a sustainable Primary Nursing care delivery system as an antidote to the task‐based nursing she saw on the unit. Seeing some hesitation in the group about where to begin, she had an idea for how to use data to get the staff council moving in the desired direction. She used call bell data obtained from the nurse call systems to get them started in the design of Primary Nursing on their unit.
The unit planned to build their Primary Nursing system utilizing RN pairs and partnerships. 1 Nurses would work in partnerships to help share select tasks such as routine nursing care, medication administration, responding to emergencies, answering call bell lights, and patient and family interactions. It was theorized that by working together as an intentional team for a select portion of the care, nurses and support staff members could serve their patients better.
The first thing they took on was the effort to decrease call bell response time, with consistent RN partners working together to figure out how to respond to patients quickly, with the goal of responding in under two minutes. As call bells rang within a range of the hallway, one of the RN partners would answer the call if the other was occupied with another responsibility. This initiative led to the nurses recognizing the complex aspects of their daily workload and enabled them to prioritize tasks differently. They used data to see what partnering strategies were working as they reduced the response time to call bells. These efforts contributed to improving staff satisfaction with both team relationships and patient care.
It was discovered that patient satisfaction was high only when the staff's satisfaction with collaborating with each other was also high. As the collaboration of the team increased and role clarity improved, the staff council saw a decline in call bell light response time, an increase in staff satisfaction with teamwork and patient care, and improvement in patient satisfaction scores.
As the collaboration of the team increased and role clarity improved, the staff council saw a decline in call bell light response time, an increase in staff satisfaction with teamwork and patient care, and improvement in patient satisfaction scores.
Their ever‐deepening understanding of how to use data even prompted the staff to inquire of the data scientist whether they could study the predictors of workload. The study that followed is described in detail in the article “Measuring Workload of Nurses on a Neurosurgical Care Unit” (Nelson, Valentino, et al., 2015).
Leaders Using Data for Inspiration: Story 2
Here is an example of how a staff‐level leader's enthusiasm for data led to some stellar, long‐lasting outcomes.
A young nurse, in practice for about 3 years, volunteered to be one of the original members of the staff council in an organization implementing Relationship‐Based Care® (Creative Health Care Management, 2017; Koloroutis, 2004). One of the major drivers of her interest was access to the clinical data and the opportunity to improve patient care with full access to outcomes of care. She had never had this sort of access before, and she was very curious about data and its implications for care delivery transformation. Her excitement at the opportunity to hear revealing new data about her unit, firsthand from the data scientist, was a large part of what drew her to take on the leadership responsibility of co‐chairing the staff council. The data was presented and explained in such a way that it motivated her to create enhancements to the professional practice model on her unit while all of the information was fully available to the staff council and unit staff members. She recalls that the availability and transparency of the data led to building relationships among staff members and their manager, and inspired them to build a strong working team.
Читать дальшеИнтервал:
Закладка:
Похожие книги на «Using Predictive Analytics to Improve Healthcare Outcomes»
Представляем Вашему вниманию похожие книги на «Using Predictive Analytics to Improve Healthcare Outcomes» списком для выбора. Мы отобрали схожую по названию и смыслу литературу в надежде предоставить читателям больше вариантов отыскать новые, интересные, ещё непрочитанные произведения.
Обсуждение, отзывы о книге «Using Predictive Analytics to Improve Healthcare Outcomes» и просто собственные мнения читателей. Оставьте ваши комментарии, напишите, что Вы думаете о произведении, его смысле или главных героях. Укажите что конкретно понравилось, а что нет, и почему Вы так считаете.


