Daniel J. Denis - Applied Univariate, Bivariate, and Multivariate Statistics Using Python
Здесь есть возможность читать онлайн «Daniel J. Denis - Applied Univariate, Bivariate, and Multivariate Statistics Using Python» — ознакомительный отрывок электронной книги совершенно бесплатно, а после прочтения отрывка купить полную версию. В некоторых случаях можно слушать аудио, скачать через торрент в формате fb2 и присутствует краткое содержание. Жанр: unrecognised, на английском языке. Описание произведения, (предисловие) а так же отзывы посетителей доступны на портале библиотеки ЛибКат.
- Название:Applied Univariate, Bivariate, and Multivariate Statistics Using Python
- Автор:
- Жанр:
- Год:неизвестен
- ISBN:нет данных
- Рейтинг книги:3 / 5. Голосов: 1
-
Избранное:Добавить в избранное
- Отзывы:
-
Ваша оценка:
Applied Univariate, Bivariate, and Multivariate Statistics Using Python: краткое содержание, описание и аннотация
Предлагаем к чтению аннотацию, описание, краткое содержание или предисловие (зависит от того, что написал сам автор книги «Applied Univariate, Bivariate, and Multivariate Statistics Using Python»). Если вы не нашли необходимую информацию о книге — напишите в комментариях, мы постараемся отыскать её.
A practical, “how-to” reference for anyone performing essential statistical analyses and data management tasks in Python Applied Univariate, Bivariate, and Multivariate Statistics Using Python
Applied Univariate, Bivariate, and Multivariate Statistics Using Python
Applied Univariate, Bivariate, and Multivariate Statistics Using Python
Applied Univariate, Bivariate, and Multivariate Statistics Using Python — читать онлайн ознакомительный отрывок
Ниже представлен текст книги, разбитый по страницам. Система сохранения места последней прочитанной страницы, позволяет с удобством читать онлайн бесплатно книгу «Applied Univariate, Bivariate, and Multivariate Statistics Using Python», без необходимости каждый раз заново искать на чём Вы остановились. Поставьте закладку, и сможете в любой момент перейти на страницу, на которой закончили чтение.
Интервал:
Закладка:
Measurement issues were also at the heart of the pandemic (though rarely addressed by the media). What exactly constituted a COVID-19 case? Differentiating between individuals who died “of” COVID-19 vs. died “with” COVID-19 was paramount, yet was often ignored in early reports. However, the question was central to everything! “Another individual died of COVID-19” does not mean anything if we do not know the mechanism or etiology of the death. Quite possibly, COVID-19 was a correlate to death in many cases, not a cause. That is, within a typical COVID-19 death could lie a virtual infinite number of possibilities that “contributed” in a sense, to the death. Perhaps one person died primarily from the virus, whereas another person died because they already suffered from severe heart disease, and the addition of the virus simply complicated the overall health issue and overwhelmed them, which essentially caused the death.
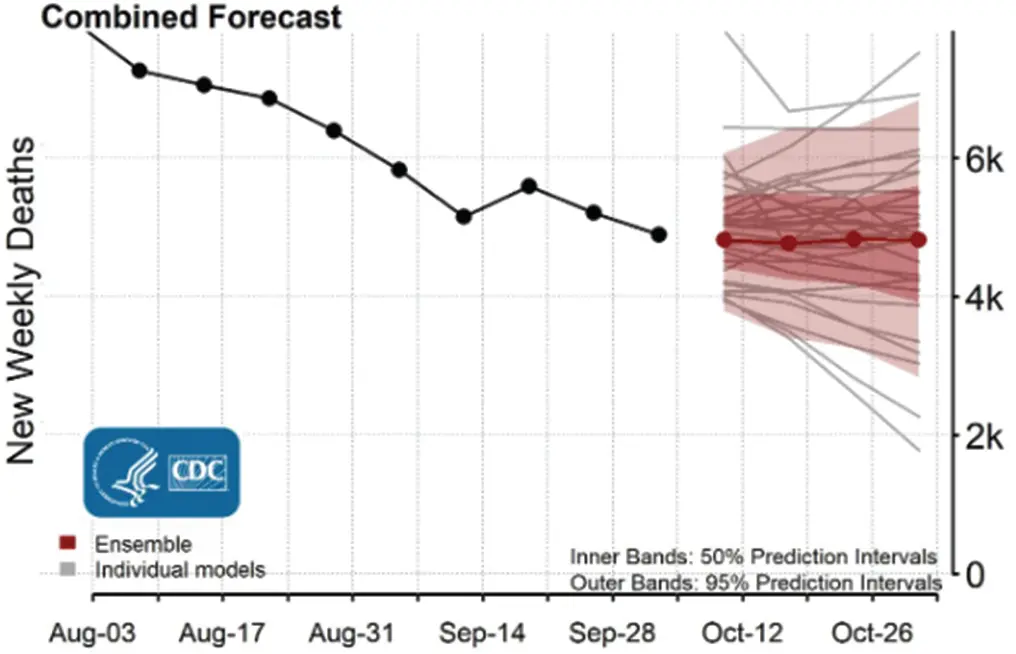
Figure 1.1 Sample death predictions in the United States during the COVID-19 pandemic in 2020. The connected dots toward the right of the plot (beyond the break in the line) represent a point predictionfor the given period (the dots toward the left are actual deaths based on prior time periods), while the shaded area represents a band of uncertainty. From the current date in the period of October 2020 forward (the time in which the image was published), the shaded area increases in order to reflect greater uncertainty in the estimate. Source: CDC (Centers for Disease Control and Prevention); Materials Developed by CDC. Used with Permission. Available at CDC ( www.cdc.gov ) free of charge .
To elaborate on the above point somewhat, measurement issuesabound in scientific research and are extremely important, even when what is being measured is seemingly, at least at first glance, relatively simple and direct. If there are issues with how best to measure something like “COVID death,” just imagine where they surface elsewhere. In psychological research, for instance, measurement is even more challenging, and in many cases adequate measurement is simply not possible. This is why some natural scientists do not give much psychological research its due (at least in particular subdivisions of psychology), because they are doubtful that the measurement of such characteristics as anxiety, intelligence, and many other things is even possible. Self-reportsare also usually fraught with difficulty as well. Hence, assessing the degree of depression present may seem trivial to someone who believes that a self-report of such symptoms is meaningless. “But I did a complex statistical analysis using my self-report data.” It doesn’t matter if you haven’t sold to the reader what you’re analyzing was successfully measured. The most important component to a house is its foundation. Some scientists would require a more definite “marker” such as a biological gene or other more physical characteristic or behavioral observation before they take your ensuing statistical analysis seriously. Statistical complexity usually does not advance a science on its own. Resolution of measurement issues is more often the paramount problem to be solved.
The key point from the above discussion is that with any research, with any scientific investigation, scientists are typically interested in estimating population parameters based on information in samples. This occurs by way of probability, and hence one can say that virtually the entire edifice of statistical and scientific inference is based on the theory of probability. Even when probability is not explicitly invoked, for instance in the case of the easy result in an experiment (e.g. 100 rats live who received COVID-19 treatment and 100 control rats die who did not receive treatment), the elements of probability are still present, as we will now discuss in surveying at a very intuitive level how classical hypothesis testing works in the sciences.
1.1 How Statistical Inference Works
Armed with some examples of the COVID-19 pandemic, we can quite easily illustrate the process of statistical inference on a very practical level. The traditional and classical workhorse of statistical inference in most sciences is that of null hypothesis significance testing(NHST), which originated with R.A. Fisher in the early 1920s. Fisher is largely regarded as the “father of modern statistics.” Most of the classical techniques used today are due to the mathematical statistics developed in the early 1900s (and late 1800s). Fisher “packaged” the technique of NHST for research workers in agriculture, biology, and other fields, as a way to grapple with uncertainty in evaluating hypotheses and data. Fisher’s contributions revolutionized how statistics are used to answer scientific questions (Denis, 2004).
Though NHST can be used in several different contexts, how it works is remarkably the same in each. A simple example will exemplify its logic. Suppose a treatment is discovered that purports to cure the COVID-19 virus and an experiment is set up to evaluate whether it does or not. Two groups of COVID-19 sufferers are recruited who agree to participate in the experiment. One group will be the control group, while the other group will receive the novel treatment. Of the subjects recruited, half will be randomly assigned to the control group, while the other half to the experimental group. This is an experimental designand constitutes the most rigorous means known to humankind for establishing the effectiveness of a treatment in science. Physicists, biologists, psychologists, and many others regularly use experimental designs in their work to evaluate potential treatment effects. You should too!
Carrying on with our example, we set up what is known as a null hypothesis, which in our case will state that the number of individuals surviving in the control group will be the same as that in the experimental group after 30 days from the start of the experiment. Key to this is understanding that the null hypothesis is about population parameters, not sample statistics. If the drug is not working, we would expect, under the most ideal of conditions, the same survival rates in each condition in the population under the null hypothesis. The null hypothesis in this case happens to specify a difference of zero; however, it should be noted that the null hypothesis does not always need to be about zero effect. The “null” in “null hypothesis” means it is the hypothesis to be nullified by the statistical test. Having set up our null, we then hypothesize a statement contrary to the null, known as the alternative hypothesis. The alternative hypothesis is generally of two types. The first is the statistical alternative hypothesis, which is essentially and quite simply a statement of the complementto the null hypothesis. That is, it is a statement of “not the null.” Hence, if the null hypothesis is rejected, the statistical alternative hypothesis is automatically inferred. For our data, suppose after 30 days, the number of people surviving in the experimental group is equal to 50, while the number of people surviving in the control group is 20. Under the null hypothesis, we would have expected these survival rates to be equal. However, we have observed a difference in our sample. Since it is merely sample data, we are not really interested in this particular result specifically. Rather, we are interested in answering the following question:
Читать дальшеИнтервал:
Закладка:
Похожие книги на «Applied Univariate, Bivariate, and Multivariate Statistics Using Python»
Представляем Вашему вниманию похожие книги на «Applied Univariate, Bivariate, and Multivariate Statistics Using Python» списком для выбора. Мы отобрали схожую по названию и смыслу литературу в надежде предоставить читателям больше вариантов отыскать новые, интересные, ещё непрочитанные произведения.


Обсуждение, отзывы о книге «Applied Univariate, Bivariate, and Multivariate Statistics Using Python» и просто собственные мнения читателей. Оставьте ваши комментарии, напишите, что Вы думаете о произведении, его смысле или главных героях. Укажите что конкретно понравилось, а что нет, и почему Вы так считаете.