Data Mining and Machine Learning Applications
Здесь есть возможность читать онлайн «Data Mining and Machine Learning Applications» — ознакомительный отрывок электронной книги совершенно бесплатно, а после прочтения отрывка купить полную версию. В некоторых случаях можно слушать аудио, скачать через торрент в формате fb2 и присутствует краткое содержание. Жанр: unrecognised, на английском языке. Описание произведения, (предисловие) а так же отзывы посетителей доступны на портале библиотеки ЛибКат.

- Название:Data Mining and Machine Learning Applications
- Автор:
- Жанр:
- Год:неизвестен
- ISBN:нет данных
- Рейтинг книги:3 / 5. Голосов: 1
-
Избранное:Добавить в избранное
- Отзывы:
-
Ваша оценка:
Data Mining and Machine Learning Applications: краткое содержание, описание и аннотация
Предлагаем к чтению аннотацию, описание, краткое содержание или предисловие (зависит от того, что написал сам автор книги «Data Mining and Machine Learning Applications»). Если вы не нашли необходимую информацию о книге — напишите в комментариях, мы постараемся отыскать её.
The book elaborates in detail on the current needs of data mining and machine learning and promotes mutual understanding among research in different disciplines, thus facilitating research development and collaboration.
Audience
Data Mining and Machine Learning Applications — читать онлайн ознакомительный отрывок
Ниже представлен текст книги, разбитый по страницам. Система сохранения места последней прочитанной страницы, позволяет с удобством читать онлайн бесплатно книгу «Data Mining and Machine Learning Applications», без необходимости каждый раз заново искать на чём Вы остановились. Поставьте закладку, и сможете в любой момент перейти на страницу, на которой закончили чтение.
Интервал:
Закладка:
It depicts by and large in what capacity will the information ‘stream’ all through the entire cycle and characterizes the fundamental squares and their functionalities. Right off the bat, the related dataset was extricated from the checking program information base, including climate information, indoor condition information, and tenant conduct records. After fundamental information cleaning and planning, the calculated relapse model was then prepared to discover the inspiration blend. At last, the inspiration sets from various individuals were looked at and gathered into a few tenant profiles. To discover the motivation behind why individuals change ventilation could be viewed as an element determination question from the viewpoint of information mining. Numerically, it’s conceivable to assemble a model to foresee individuals’ conduct under a specific condition and afterward quantitatively assess the significance of each component. L1-regularized calculated relapse is a hearty answer for this reason by training. Up to the network level, contrasting various examples and gathering ones and likenesses is called grouping in the information mining area. This sort of calculations, for example, broadly utilized K-implies, could gather various examples into a few bunches with the best improved in-group closeness and between bunch distinction. In the accompanying of this segment, the strategy referenced will be quickly presented. Calculated relapse, regardless of its name, is a straight model for the arrangement as opposed to relapse. It is likewise referred to in writing as logit relapse, most extreme entropy characterization (MaxEnt), or the log-direct classifier. This is a standard direct relapse formula
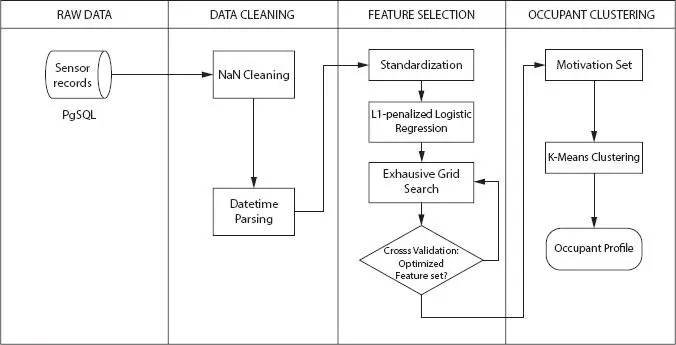
Figure 2.9 Shows the schematic outline of the information mining-based strategy.
(2.1) 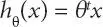
where x is a progression of highlights, it is a vector containing coefficients for each component and speaks to the relapse result. While in strategic relapse, since we need to do a grouping rather than relapse, the direct relapse condition is fitted into a sigmoid capacity
(2.2) 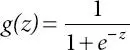
Finally, the condition of calculated relapse becomes
(2.3) 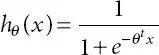
The capacity is plotted in Figure 2.10. It could be seen that the scope of calculated relapse yield is somewhere in the range of 0 and 1. A limit, say 0.5, could be picked to isolate two distinct classifications (for example, whenever output <0.50, anticipate the case to be in class 0, else foresee classification 1). In the wake of preparing with the dataset, which planned for finding improved θ to limit the cost work, the model is acclimated to limit the expectation mistake dependent on the preparation set and the coefficients of each component.
(2.4) 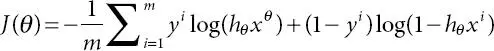
Depending on its direct existence, the function of each variable in a planned, measured regression model is utilized to determine its importance.
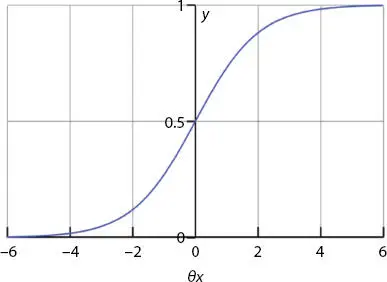
Figure 2.10 Calculated regression output.
Most counterpart experts have accepted the sufficiency, extensibility, and heartfeltness of this technique; however, in this role, the operational regression component used is with L1-standard regularisation, which means an additional punishment element arising from the L1-st. The model runs over and over λ to render a matrix scan. At last stops at the boundary blend, which gives the highest approval accuracy,
(2.5) 
As direct model punished with the L1 standard will, in general, give inadequate arrangements. For example, a large number of its assessed coefficients would be zero. Subsequently, it will make the element choice more critical has become one of the least intrusive equations in independent learning, able to take care of the grouping problem with great usability. It plans to parcel n perceptions into k bunches where each perspective does have the nearest mean only with the group. The category allocations with high market share-bunch similarity and lower academic consistency would be considered an appropriate performance. In particular, measurement gives a similar method to bundle a specified data index through several classes. The fundamental concept is to initially classify k centroids, one for each group, which should be placed in a crafty manner because distinctive area causes diverse outcomes. The next stage is to bring each specific to an available data set and match it to the nearest centroid. Since no point arrives, the initial phase is stopped and an early gathering is done. Now we have to re-evaluate k new centroids as the knowledge guide’s barycenter getting a position to a particular bunch due to past advances. Since we have these new centroids, another pairing between similar knowledge collection focuses and the closest new centroid should be possible. The circle was formed so far. As a result of this circle, we can see that the centroids change their area bit by bit until no change. At the end of the day, centroids pass nothing else after several circles. Finally, this estimate aims to restrict the target function, a square blunder function for this situation.
(2.6) 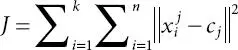
where  is the picked separation measure amongst an information point and the group place it has a place with. For this situation, we pick Euclidean separation as the separation measure technique. In this examination, the K-implies bunching is utilized to aggregate inhabitants from 10 unique houses into a few kinds. This methodology has been approved likewise via the exploration commencing.
2.4 Results
The method is developed to predict how much a development/decrease adjustment will occur based on input factors such as time and inner situation. In the time leading up to measurement, the planning set was standardized, meaning that all highlights are rescaled to zero mean and unit-fluctuation dispersions. At that point, the dataset is cared for in an L1-punished strategic relapse classifier, which will streamline the cost capacity to predict the response of residents in a particular situation. As the portion scale is normalized, the prepared straight model coefficient may show the overall meaning of the compared element. For example, Figure 2.11Indicates the importance of each trigger factor for tenant No. 1, with the model being 86% inter-approved.
Читать дальшеИнтервал:
Закладка:
Похожие книги на «Data Mining and Machine Learning Applications»
Представляем Вашему вниманию похожие книги на «Data Mining and Machine Learning Applications» списком для выбора. Мы отобрали схожую по названию и смыслу литературу в надежде предоставить читателям больше вариантов отыскать новые, интересные, ещё непрочитанные произведения.


Обсуждение, отзывы о книге «Data Mining and Machine Learning Applications» и просто собственные мнения читателей. Оставьте ваши комментарии, напишите, что Вы думаете о произведении, его смысле или главных героях. Укажите что конкретно понравилось, а что нет, и почему Вы так считаете.