Geza Varkuti - Renko Forex strategy - Let's make money
Здесь есть возможность читать онлайн «Geza Varkuti - Renko Forex strategy - Let's make money» — ознакомительный отрывок электронной книги совершенно бесплатно, а после прочтения отрывка купить полную версию. В некоторых случаях можно слушать аудио, скачать через торрент в формате fb2 и присутствует краткое содержание. Жанр: unrecognised, на английском языке. Описание произведения, (предисловие) а так же отзывы посетителей доступны на портале библиотеки ЛибКат.

- Название:Renko Forex strategy - Let's make money
- Автор:
- Жанр:
- Год:неизвестен
- ISBN:нет данных
- Рейтинг книги:3 / 5. Голосов: 1
-
Избранное:Добавить в избранное
- Отзывы:
-
Ваша оценка:
Renko Forex strategy - Let's make money: краткое содержание, описание и аннотация
Предлагаем к чтению аннотацию, описание, краткое содержание или предисловие (зависит от того, что написал сам автор книги «Renko Forex strategy - Let's make money»). Если вы не нашли необходимую информацию о книге — напишите в комментариях, мы постараемся отыскать её.
On the following pages a centuries-old Japanese technique, the actual application of the Renko chart will be discussed. According to the descriptions, rice traders used this technique to visualize the movement of the rice prices. Were they the first futures traders?
The Japanese culture is known for simple elegant forms and clear lines, both in the world of design and thought, but this simplicity originates from reducing things to their most essential content.
If we see a chart of a currency pair, index or a bond today, we can read a lot of information out of it. Opening and closing prices can be seen up to 1 minute resolution, peaks, volumes, etc. Now if we pack up a few more indicator to the chart, draw more trend lines, look at Fibonacci-levels etc. we believe we know almost everything about the current status of the market, but what does all this really tell us about the future? Does it really help us to make trading decisions, or is all that wealth of information just giving us the illusion of predictability?
The Renko charts do not care about the time, but are solely focused on the movements. It only shows that the price has taken a certain distance or not. No matter how long that takes. This creates a clean chart with no unnecessary information, which is much easier to read.
This is the basic of my winnig strategy.
Renko Forex strategy - Let's make money — читать онлайн ознакомительный отрывок
Ниже представлен текст книги, разбитый по страницам. Система сохранения места последней прочитанной страницы, позволяет с удобством читать онлайн бесплатно книгу «Renko Forex strategy - Let's make money», без необходимости каждый раз заново искать на чём Вы остановились. Поставьте закладку, и сможете в любой момент перейти на страницу, на которой закончили чтение.
Интервал:
Закладка:
Imprint
Copyright: © 2014 Géza Várkuti
Published by: epubli GmbH, Berlin, www.epubli.de
ISBN 978-3-7375-2629-6
Table of Contents
Imprint Imprint Copyright: © 2014 Géza Várkuti Published by: epubli GmbH, Berlin, www.epubli.de ISBN 978-3-7375-2629-6
Results* Results* First of all, I think everyone is interested in how profitable this strategy is, the results are available here:
Prologue Prologue The first step on the road to perfection is to focus on the essentials. There is an ancient Japanese proverb, which sounds like this. It hasn´t been put here by accident. On the following pages a centuries-old Japanese technique, the actual application of the Renko chart will be discussed. According to the descriptions, rice traders used this technique to visualize the movement of the rice prices. Were they the first futures traders? The Japanese culture is known for simple elegant forms and clear lines, both in the world of design and thought, but this simplicity originates from reducing things to their most essential content. If we see a chart of a currency pair, index or a bond today, we can read a lot of information out of it. Opening and closing prices can be seen up to 1 minute resolution, peaks, volumes, etc. Now if we pack up a few more indicator to the chart, draw more trend lines, look at Fibonacci-levels etc. we believe we know almost everything about the current status of the market, but what does all this really tell us about the future? Does it really help us to make trading decisions, or is all that wealth of information just giving us the illusion of predictability? Already the temporal resolution of the chart itself is questionable. If we imagine that the exchange rate movements are really endless undulating streams, then why we do we aggregate that information in a way that makes a candle appear in every hour? Or why do we assume that the opening and closing value is a more important piece of information than the top or bottom of the spikes? Why do we say that the 10:00 tick - optionally the middle of a rising wave – is more relevant than the 9:46 tick? Why? Obviously we need handrails, we pull a time grid on the market to make it easier to map it, but it is fairly arbitrary. Don´t you think so too? The Renko charts do not care about the time, but are solely focused on the movements. It only shows that the price has taken a certain distance or not. No matter how long that takes. This creates a clean chart with no unnecessary information, which is much easier to read. Let's look at how it is structured, how it should be interpreted and applied.
The Renko chart
Renko chart in MetaTrader 4
The use of the Renko chart
Renko zig-zag strategy
Entry – Stop - Closing
Pull into breakeven
Reopen
Lossy situations
Breakeven situations
Profitable situations
Summarizing
Difficulties - errors
Results – alternative exit strategies
XAUUSD
DAX
GBPJPY
Summarizing
Automated version – Expert Advisor
The author
Terms
High risk warning
Results*
First of all, I think everyone is interested in how profitable this strategy is, the results are available here:
2012
XAUUSD 1952 pip
2013
XAUUSD 4118 pip
Until 30 September 2014
XAUUSD 1916 pip
GER30 (DAX) 2690 pip
GBPJPY 1756 pip
* Past and back test data do not constitute guarantees of future performance .
Prologue
The first step on the road to perfection is to focus on the essentials. There is an ancient Japanese proverb, which sounds like this. It hasn´t been put here by accident.
On the following pages a centuries-old Japanese technique, the actual application of the Renko chart will be discussed. According to the descriptions, rice traders used this technique to visualize the movement of the rice prices. Were they the first futures traders?
The Japanese culture is known for simple elegant forms and clear lines, both in the world of design and thought, but this simplicity originates from reducing things to their most essential content.
If we see a chart of a currency pair, index or a bond today, we can read a lot of information out of it. Opening and closing prices can be seen up to 1 minute resolution, peaks, volumes, etc. Now if we pack up a few more indicator to the chart, draw more trend lines, look at Fibonacci-levels etc. we believe we know almost everything about the current status of the market, but what does all this really tell us about the future? Does it really help us to make trading decisions, or is all that wealth of information just giving us the illusion of predictability?
Already the temporal resolution of the chart itself is questionable. If we imagine that the exchange rate movements are really endless undulating streams, then why we do we aggregate that information in a way that makes a candle appear in every hour? Or why do we assume that the opening and closing value is a more important piece of information than the top or bottom of the spikes? Why do we say that the 10:00 tick - optionally the middle of a rising wave – is more relevant than the 9:46 tick? Why? Obviously we need handrails, we pull a time grid on the market to make it easier to map it, but it is fairly arbitrary. Don´t you think so too?
The Renko charts do not care about the time, but are solely focused on the movements. It only shows that the price has taken a certain distance or not. No matter how long that takes. This creates a clean chart with no unnecessary information, which is much easier to read.
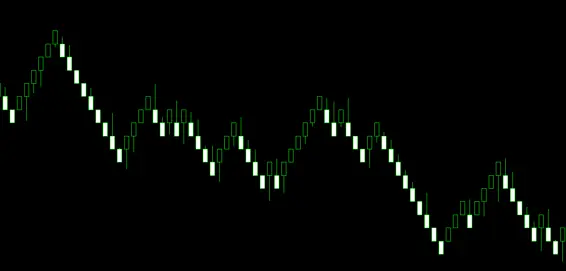
Let's look at how it is structured, how it should be interpreted and applied.
Конец ознакомительного фрагмента.
Текст предоставлен ООО «ЛитРес».
Прочитайте эту книгу целиком, купив полную легальную версию на ЛитРес.
Безопасно оплатить книгу можно банковской картой Visa, MasterCard, Maestro, со счета мобильного телефона, с платежного терминала, в салоне МТС или Связной, через PayPal, WebMoney, Яндекс.Деньги, QIWI Кошелек, бонусными картами или другим удобным Вам способом.
Интервал:
Закладка:
Похожие книги на «Renko Forex strategy - Let's make money»
Представляем Вашему вниманию похожие книги на «Renko Forex strategy - Let's make money» списком для выбора. Мы отобрали схожую по названию и смыслу литературу в надежде предоставить читателям больше вариантов отыскать новые, интересные, ещё непрочитанные произведения.


Обсуждение, отзывы о книге «Renko Forex strategy - Let's make money» и просто собственные мнения читателей. Оставьте ваши комментарии, напишите, что Вы думаете о произведении, его смысле или главных героях. Укажите что конкретно понравилось, а что нет, и почему Вы так считаете.