Social Network Analysis
Здесь есть возможность читать онлайн «Social Network Analysis» — ознакомительный отрывок электронной книги совершенно бесплатно, а после прочтения отрывка купить полную версию. В некоторых случаях можно слушать аудио, скачать через торрент в формате fb2 и присутствует краткое содержание. Жанр: unrecognised, на английском языке. Описание произведения, (предисловие) а так же отзывы посетителей доступны на портале библиотеки ЛибКат.

- Название:Social Network Analysis
- Автор:
- Жанр:
- Год:неизвестен
- ISBN:нет данных
- Рейтинг книги:4 / 5. Голосов: 1
-
Избранное:Добавить в избранное
- Отзывы:
-
Ваша оценка:
Social Network Analysis: краткое содержание, описание и аннотация
Предлагаем к чтению аннотацию, описание, краткое содержание или предисловие (зависит от того, что написал сам автор книги «Social Network Analysis»). Если вы не нашли необходимую информацию о книге — напишите в комментариях, мы постараемся отыскать её.
As social media dominates our lives in increasing intensity, the need for developers to understand the theory and applications is ongoing as well. This book serves that purpose.
Audience
Social Network Analysis — читать онлайн ознакомительный отрывок
Ниже представлен текст книги, разбитый по страницам. Система сохранения места последней прочитанной страницы, позволяет с удобством читать онлайн бесплатно книгу «Social Network Analysis», без необходимости каждый раз заново искать на чём Вы остановились. Поставьте закладку, и сможете в любой момент перейти на страницу, на которой закончили чтение.
Интервал:
Закладка:
6 Repetitive tasks can be easily done by automation, which is not possible in Excel.
7 Python provides in-depth visualizations, whereas Excel has basic graphs [12].
2.6 Installation
Python installation consumes a bit more time because it should be properly downloaded in the right environment with all the necessary packages [13]. The standard version of python can be installed from the following link [ https://www.python.org/downloads/].
Different versions of Python with respect to the type of OS (Windows, Mac, Linux) can be found under this link.
Some important package for SNA is pandas, matplotlib, and NetworkX. All these packages can be installed via pip installation.
– pip install pandas
– pip install network
– pip install matplotlib
NetworkX is an important library used to analyze social network in Python [14]. The package is mainly created to analyze the functions of complex graph structure. It is a free package under BSD license.
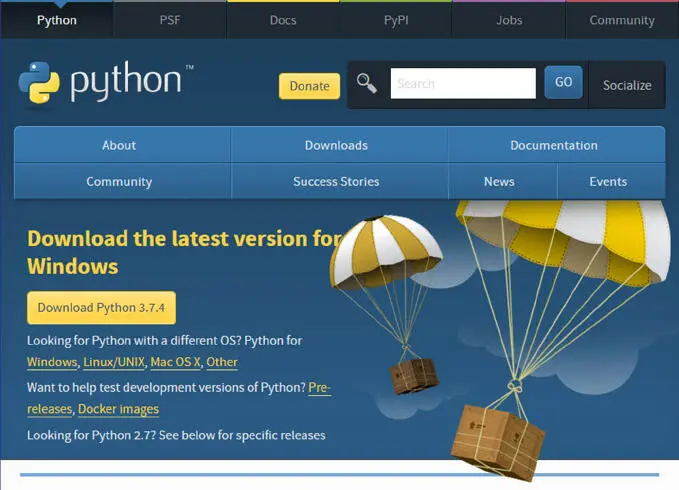
Figure 2.7Python official documentation.
2.6.1 Good Practices
1 It is always advised to install virtual environments like Anaconda environment. Miniconda can be used instead of anaconda if the computer has less than 5 Gb ram [15]. You can download the standard version of Anaconda here [ https://docs.anaconda.com/anaconda/install/].
2 Choosing editors, such as VS code or pycharm or IntellIj or Jupyter Notebooks, and so on, comes along with the Anaconda environment.
3 Proceed with open-source version at the beginning. Use Anaconda Navigator→ interactive Visual mode Or Prompt Terminal Mode:– Creating new environments in Anaconda: conda create— name myenv– Replace myenv with the environment name.– Activate Environment: conda activate myenv– Installing packages: conda install [packagename]
The more useful resources and explanations on working with conda environment can be found in their official documentation.
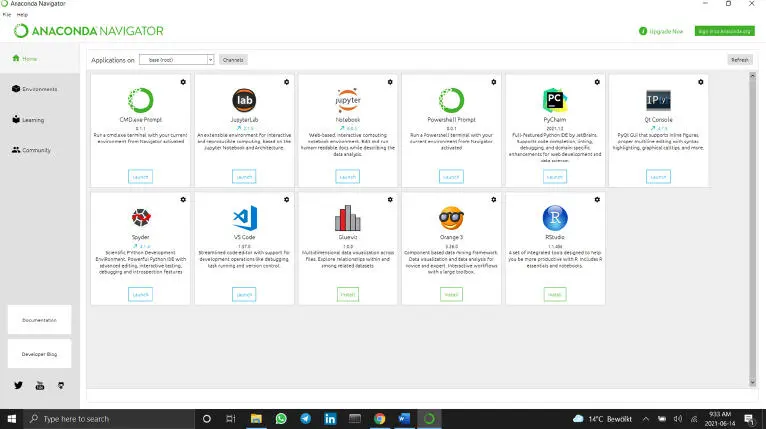
Figure 2.8Anaconda navigator.
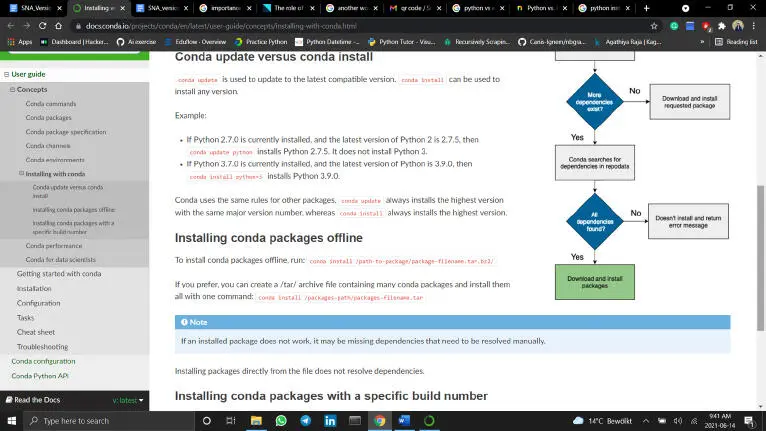
Figure 2.9Conda environment installation.
2.7 Use Case
Some interesting case studies based on SNA are Facebook friends’ group and terrorist activities [16]. The case study has been worked in python with Jupyter notebook. You can download and explore the data set to get more insight under the following link.
Scan the QR code and follow the Github link to access the worksheets.

Figure 2.10QR code for workbooks and source codes.
2.7.1 Facebook Case Study
The first important steps in analyzing any kind of data set in python is importing libraries . The data to be analyzed can be scrapped directly from the respective site or it can be accessed from the API provided by the website [17]. Choosing the data mainly depends on the need, i.e., why do we need to analyze the data? What is the purpose? What kind of problem are we solving? [18]
Step 1: Import libraries
Each library has their built-in function, which makes Python easy to code.
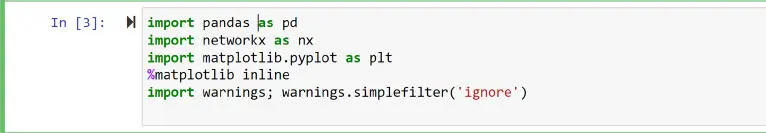
Figure 2.11Code blocks for importing libraries.
Step 2: Read data
Pandas is used to retrieve the data and can be used to explore a huge data set conveniently.
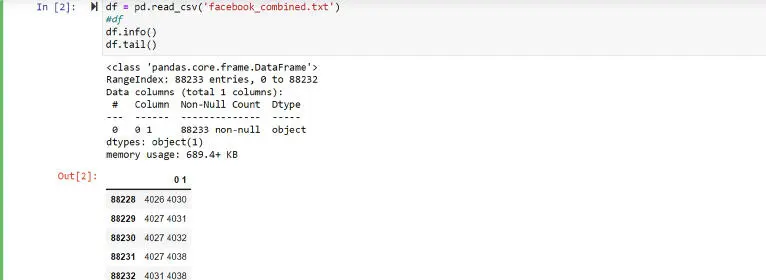
Figure 2.12Code block for reading data.
Step 3: Data cleaning
Data cleaning means removing/cleaning the noise (NaN, Missing data) [19]. Data quality will have more impact in the model so using the data with less noise is recommended for better results. Missing values can be altered by generating the mean, median value and so on [20–22]. It completely depends upon the type of data.
Step 4: Read input
read_edgelist is a built-in function in NetworkX library. More details about it can be found in the documentation website. [23]
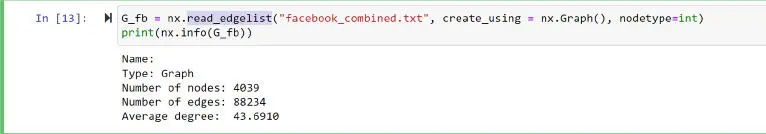
Figure 2.13Code block for reading edge list.
Step 5: Visualizing the network
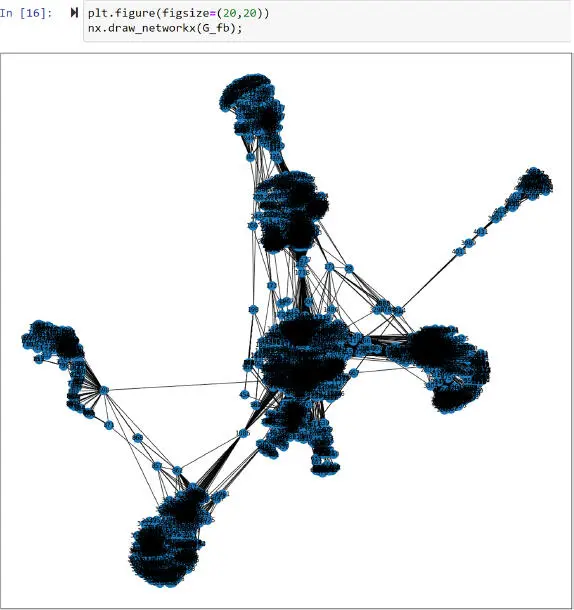
Figure 2.14Visualization of Facebook users.
Step 6: Centrality measures
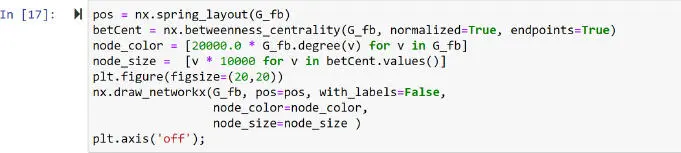
Figure 2.15Code block for centrality measures.
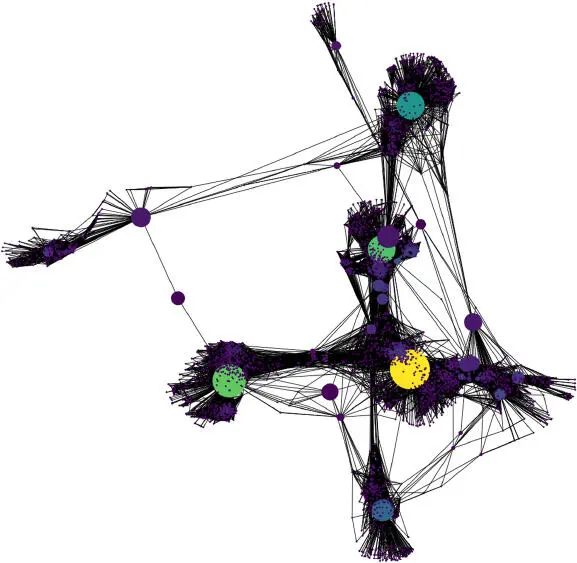
Figure 2.16Visualization of centrality measures on Facebook users.
2.8 Real-Time Product From SNA
One of the innovative and fancy real-time products out of network analysis is nevaal maps, which is created by nevaal AG, a German company focused mainly on network analysis for business.
Company Vision:
The motive of the company is to “create a front-line solution to visualize information from our social circles.”
2.8.1 Nevaal Maps
It is the SaaS application used in business network analytics. It connects the network (group of people) in the business network together to track them, getting in touch and to make better decision. The capability of it to handle the complex data makes it easier for any start-up to keep their organization in a structured manner.
The three important features about nevaal maps, which makes it more efficient, are as follows: scalable, secure, and customizable . The central mechanism can be adjusted according to individual customer need.
Usage
Visualizing the complex network data helps in
– Screening process and investment decisions.
– Enabling the internal/external process of data.
– Providing interactive and insightful view of the business data.
Significancy
The product is not only focusing on visualizing the network connection but also aids in manifesting communication processes, which is outcome focused.
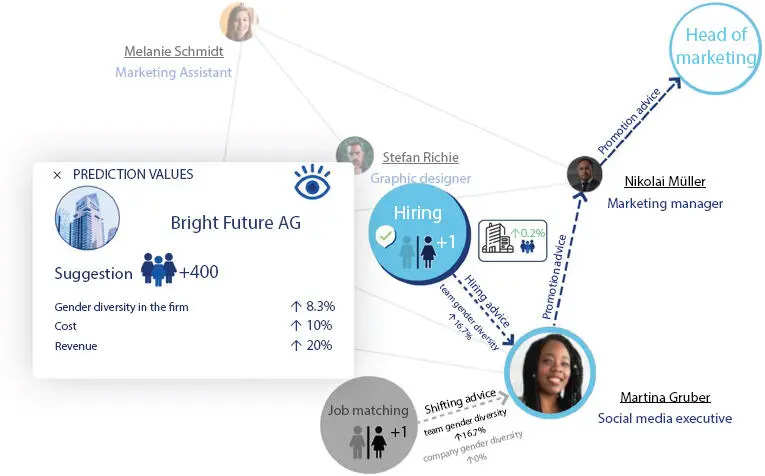
Figure 2.17Visualization of graph database used in business.
Читать дальшеИнтервал:
Закладка:
Похожие книги на «Social Network Analysis»
Представляем Вашему вниманию похожие книги на «Social Network Analysis» списком для выбора. Мы отобрали схожую по названию и смыслу литературу в надежде предоставить читателям больше вариантов отыскать новые, интересные, ещё непрочитанные произведения.


Обсуждение, отзывы о книге «Social Network Analysis» и просто собственные мнения читателей. Оставьте ваши комментарии, напишите, что Вы думаете о произведении, его смысле или главных героях. Укажите что конкретно понравилось, а что нет, и почему Вы так считаете.