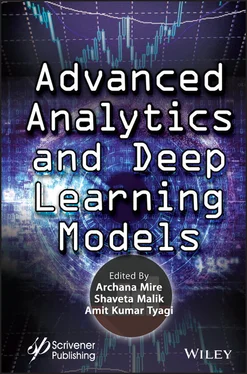
Advanced Analytics and Deep Learning Models
Здесь есть возможность читать онлайн «Advanced Analytics and Deep Learning Models» — ознакомительный отрывок электронной книги совершенно бесплатно, а после прочтения отрывка купить полную версию. В некоторых случаях можно слушать аудио, скачать через торрент в формате fb2 и присутствует краткое содержание. Жанр: unrecognised, на английском языке. Описание произведения, (предисловие) а так же отзывы посетителей доступны на портале библиотеки ЛибКат.
- Название:Advanced Analytics and Deep Learning Models
- Автор:
- Жанр:
- Год:неизвестен
- ISBN:нет данных
- Рейтинг книги:5 / 5. Голосов: 1
-
Избранное:Добавить в избранное
- Отзывы:
-
Ваша оценка:
- 100
- 1
- 2
- 3
- 4
- 5
Advanced Analytics and Deep Learning Models: краткое содержание, описание и аннотация
Предлагаем к чтению аннотацию, описание, краткое содержание или предисловие (зависит от того, что написал сам автор книги «Advanced Analytics and Deep Learning Models»). Если вы не нашли необходимую информацию о книге — напишите в комментариях, мы постараемся отыскать её.
The book provides readers with an in-depth understanding of concepts and technologies related to the importance of analytics and deep learning in many useful real-world applications such as e-healthcare, transportation, agriculture, stock market, etc.
Audience
Advanced Analytics and Deep Learning Models — читать онлайн ознакомительный отрывок
Ниже представлен текст книги, разбитый по страницам. Система сохранения места последней прочитанной страницы, позволяет с удобством читать онлайн бесплатно книгу «Advanced Analytics and Deep Learning Models», без необходимости каждый раз заново искать на чём Вы остановились. Поставьте закладку, и сможете в любой момент перейти на страницу, на которой закончили чтение.
Интервал:
Закладка:
2 Chapter 2 Figure 2.1 Flow of work. Figure 2.2 Missing values. Figure 2.3 Visualizing missing values using heatmap. Figure 2.4 Different BHK attribute. Figure 2.5 Bath visualization. Figure 2.6 BHK visualization. Figure 2.7 Scatter plot for 2 and 3 BHK flat for total square feet. Figure 2.8 Scatter plot for 2 And 3 BHK flat for total square feet after removin...
3 Chapter 3 Figure 3.1 Working principle of MCRS. Figure 3.2 Phases of MCRS. Figure 3.3 Filtering techniques of MCRS. Figure 3.4 Result comparison. Figure 3.5 Experimental result. Figure 3.6 Result.
4 Chapter 4Figure 4.1 Advancement of artificial intelligence.Figure 4.2 AI, ML, and DL.Figure 4.3 Working network of deep learning.Figure 4.4 Difference between ML and DL.Figure 4.5 Types of ML.Figure 4.6 Supervised learning algorithm.Figure 4.7 Unsupervised learning algorithm.Figure 4.8 Reinforcement algorithm.Figure 4.9 Supervised, unsupervised, and reinforcement learning.Figure 4.10 Regression algorithms.Figure 4.11 Instance-based algorithms.Figure 4.12 Regularization algorithms.Figure 4.13 Decision algorithms.Figure 4.14 Bayesian algorithms.Figure 4.15 Clustering algorithms.Figure 4.16 Association rule learning algorithms.Figure 4.17 Artificial neural network algorithms.Figure 4.18 Deep learning algorithms.Figure 4.19 Dimensional reduction algorithms.Figure 4.20 Ensemble algorithms.Figure 4.21 Convolutional Neural Networks.Figure 4.22 How our DL algorithm sees an image.Figure 4.23 Convolution layers.Figure 4.24 DL terminology examples.Figure 4.25 Neural network.Figure 4.26 AI or real Shakespeare?Figure 4.27 GAN.Figure 4.28 GAN examples.Figure 4.29 GAN example.Figure 4.30 GAN used to create painting.Figure 4.31 AI in chatbots.Figure 4.32 Behavior of the sentiment neuron. Colors show the type of sentiment.Figure 4.33 Flowchart of the methodology.Figure 4.34 Flowchart includes training and testing.Figure 4.35 Values of the trained dataset matrices.Figure 4.36 Values of the tested datasets matrices.Figure 4.37 Sample cervical cancer magnetic resonance image (MRI).Figure 4.38 Loading the MRI image from datasets.Figure 4.39 Contrast enhancement.Figure 4.40 Image segmentation.Figure 4.41 Segmented region of interest (ROI).Figure 4.42 After classification, cervical cancer (ROI) tumor is found.Figure 4.43 After classification, cervical cancer region of interest (ROI) tumor...
5 Chapter 7Figure 7.1 (A) Kannada Main Aksharas.Figure 7.1 (B) Kannada Vatt Aksharas.Figure 7.2 Training of CNN for kannada characters.Figure 7.3 (A) Sample image.Figure 7.3 (B) Output edible text.Figure 7.4 Recurrent neural network architecture.Figure 7.5 Simple RNN.Figure 7.6 Long short-term memory networks.Figure 7.7 Fully gated version.Figure 7.8 Type 1 GRU.Figure 7.9 Type 2 GRU.Figure 7.10 Type 3 GRU.Figure 7.11 Architecture of denoising autoencoder.Figure 7.12 Architecture of RCNN.Figure 7.13 Architecture of deep belief networks.
6 Chapter 8Figure 8.1 Classification of deep neural network.Figure 8.2 Valence arousal model.Figure 8.3 EEG setup.Figure 8.4 Training and validation accuracy for DEAP dataset.
7 Chapter 9Figure 9.1 Comparison of healthy brain and AD-affected brain.Figure 9.2 (a) sMRI example and [20] (b) fMRI example [21].Figure 9.3 Example of PET [22].Figure 9.4 OASIS example images [25].Figure 9.5 CNN—Example [30].Figure 9.6 Architecture—UUNet [34].Figure 9.7 Architecture of CNN presented by Santos et al. [3].Figure 9.8 Architecture of detection model presented by Alejandro et al. [4].Figure 9.9 Architecture of the hybrid model [5].Figure 9.10 Architecture of DCssCDBM [6].Figure 9.11 “Siamese Net” Architecture [6].Figure 9.12 Architecture of Lin Liu that utilizes spectrogram [7].Figure 9.13 “MRICloud” representation [8].Figure 9.14 “Siamese Net” architecture of [8].Figure 9.15 Architecture of deep learning technique for Parkinson’s [9].Figure 9.16 Architecture of MDS-UPDRS [10].
8 Chapter 10Figure 10.1 Concepts and theories in deep learning.Figure 10.2 Process of deep neural network (DNN).Figure 10.3 Convolution layers feeding image data into a fully-connected layer [...
9 Chapter 11Figure 11.1 An optimizer framework.Figure 11.2 Proposed choices for training of a NN.Figure 11.3 Three steps toward generalization.Figure 11.4 Optimization: Issues and challenges.Figure 11.5 A 3-D representation with local and global minima (maxima).Figure 11.6 A MAS mixing logo.Figure 11.7 Sample output showing three different classes.Figure 11.8 (a) SGD with “lrate” and accuracy with number of epochs. (b) ADAM wi...Figure 11.9 MNIST handwriting data.Figure 11.10 (a, b) Different optimizers with loss and accuracy.
10 Chapter 12Figure 12.1 Characteristics of Big Data [2].Figure 12.2 One dimensional illustration (COVID-19 cases maximum in Mumbai and P...Figure 12.3 Two-dimensional representation of Covid Cases in Pune [15].Figure 12.4 Cartogram of India where each color represents different states of I...Figure 12.5 Distribution of population.Figure 12.6 Proportional map for Highest cases in different zones [11]. Left are...Figure 12.7 Contour map for COVID-19 patients [16].Figure 12.8 Three-Dimensional Visualization of Zones and the count of Patients i...Figure 12.9 COVID-19 cases in three major cities of Maharashtra from March to Ju...Figure 12.10 COVID-19 cases from March to June in timeline chart [17].Figure 12.11 COVID-19 cases in different areas [16].Figure 12.12 Death rate of Maharashtra in metro cities [16].Figure 12.13 Most case in March-April (Mumbai) [16].Figure 12.14 Weather prediction [16].Figure 12.15 Major cases in three states of India [16].Figure 12.16 Covid cases in Mumbai and Pune (March-July) [9]. We can say that tw...Figure 12.17 Dendrogram data analysis of COVID-19 [12].Figure 12.18 Spreading of Corona virus from root node to last node [16].Figure 12.19 Hierarchy of data visualization according to department [12].Figure 12.20 Two-dimensional histogram (different colour) shows age group and to...Figure 12.21 Two-Dimensional Contour with different age [9].Figure 12.22 Polar scatter in which age and new confirmed cases is shown in 0° t...
11 Chapter 13Figure 13.1 Addressing e-governance.Figure 13.2 Urban population fraction in various geographical regions.Figure 13.3 Smart cities’ mission and housing in India.Figure 13.4 Apache Hadoop framework architecture adopted for smart city governan...Figure 13.5 Layered architecture of big data system (from bottom to up).Figure 13.6 Three stages of data acquisition system.Figure 13.7 An overview model flow for smart governance for citizen services and...Figure 13.8 Worldwide big data and Hadoop market size.
12 Chapter 14Figure 14.1 (a) Cloud computing to edge computing transition. (b) Cloud computin...Figure 14.2 The timeline of DC.Figure 14.3 Taxonomy of fog framework.Figure 14.4 Layered CloudSim architecture.Figure 14.5 SPECI package.Figure 14.6 Architecture of the OCT cloud simulator.
13 Chapter 16Figure 16.1 Evolution of computational methods.
Guide
1 Cover
2 Table of Contents
3 Title Page
4 Copyright
5 Preface
6 Begin Reading
7 Index
8 Also of Interest
9 End User License Agreement
Pages
1 v
2 ii
3 iii
4 iv
5 xix
6 xx
7 1
8 3
9 4
10 5
11 6
12 7
13 8
14 9
15 10
16 11
17 12
18 13
19 14
20 15
21 16
22 17
23 19
24 20
25 21
26 22
27 23
28 24
29 25
30 26
31 27
32 28
33 29
34 30
35 31
36 32
37 33
38 34
39 35
40 36
41 37
42 38
43 39
44 40
45 41
46 42
47 43
48 44
49 45
50 46
51 47
52 48
53 49
54 50
55 51
56 52
57 53
Читать дальшеИнтервал:
Закладка:
Похожие книги на «Advanced Analytics and Deep Learning Models»
Представляем Вашему вниманию похожие книги на «Advanced Analytics and Deep Learning Models» списком для выбора. Мы отобрали схожую по названию и смыслу литературу в надежде предоставить читателям больше вариантов отыскать новые, интересные, ещё непрочитанные произведения.
Обсуждение, отзывы о книге «Advanced Analytics and Deep Learning Models» и просто собственные мнения читателей. Оставьте ваши комментарии, напишите, что Вы думаете о произведении, его смысле или главных героях. Укажите что конкретно понравилось, а что нет, и почему Вы так считаете.
