James A. Jahnke - Continuous Emission Monitoring
Здесь есть возможность читать онлайн «James A. Jahnke - Continuous Emission Monitoring» — ознакомительный отрывок электронной книги совершенно бесплатно, а после прочтения отрывка купить полную версию. В некоторых случаях можно слушать аудио, скачать через торрент в формате fb2 и присутствует краткое содержание. Жанр: unrecognised, на английском языке. Описание произведения, (предисловие) а так же отзывы посетителей доступны на портале библиотеки ЛибКат.
- Название:Continuous Emission Monitoring
- Автор:
- Жанр:
- Год:неизвестен
- ISBN:нет данных
- Рейтинг книги:4 / 5. Голосов: 1
-
Избранное:Добавить в избранное
- Отзывы:
-
Ваша оценка:
Continuous Emission Monitoring: краткое содержание, описание и аннотация
Предлагаем к чтению аннотацию, описание, краткое содержание или предисловие (зависит от того, что написал сам автор книги «Continuous Emission Monitoring»). Если вы не нашли необходимую информацию о книге — напишите в комментариях, мы постараемся отыскать её.
The new edition of the only single-volume reference on both the regulatory and technical aspects of U.S. and international continuous emission monitoring (CEM) systems Continuous Emission Monitoring
Continuous Emission Monitoring:
Continuous Emission Monitoring, Third Edition
Continuous Emission Monitoring — читать онлайн ознакомительный отрывок
Ниже представлен текст книги, разбитый по страницам. Система сохранения места последней прочитанной страницы, позволяет с удобством читать онлайн бесплатно книгу «Continuous Emission Monitoring», без необходимости каждый раз заново искать на чём Вы остановились. Поставьте закладку, и сможете в любой момент перейти на страницу, на которой закончили чтение.
Интервал:
Закладка:
s = subscript denoting “stack”
For coal‐fired plants, flow monitors are specified for monitoring the flue gas volumetric flow. For gas‐ and oil‐fired plants, the fuel flow in conjunction with an O 2or CO 2“diluent” monitor can be used instead, to calculate the flue (stack) gas volumetric flow (see Appendix A).
Under the acid rain program, NO xemissions were not traded, but instead regulated under lb/mmBtu emission limits. Emissions are calculated using F‐factor methods, where the emissions in lb/mmBtu are determined from Equation 2‐2:
(2‐2) 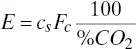
where
E = emissions in units of lb/mmBtu (or ng/J)
cs = NOx concentration
Fc = carbon dioxide F factor
Here, a NO xmonitor and diluent monitor measuring either CO 2or O 2are necessary to perform the calculation. F factors can be found in Table A‐2.
Since CEM systems are used to determine mass emission rates and, therefore, available allowances, it is essential that the CEM systems installed for this purpose meet high levels of accuracy and precision. Consequently, EPA established a new set of rules and performance specifications for CEM systems in 40 CFR 75, increasing the stringency of monitoring requirements from those originally promulgated in the New Source Performance Standards of 40 CFR 60 (U.S. EPA 2020g). As a result, CEM systems essentially became the “gold standard” by which the program operated. Because of the importance of the program and its potential costs, utility managers purchased new CEM systems, assigned engineers to oversee the monitoring programs, and provided financial and staff resources for their operation and maintenance. This led to a new generation of CEM systems and a new generation of CEM professionals. Close cooperation between utility professionals, regulators from the EPA Clean Air Markets Division (CAMD), and CEM system vendors contributed greatly to the overall success of the program (Schakenbach and Forte 2006).
Because of the more stringent monitoring requirements and incentives, Part 75 CEM systems typically achieve relative accuracies of <5%, in contrast to the minimum specification of <20% in Part 60 and <10% in Part 75 (Mangus 1997). Some utility managers initially installed redundant systems, concerned that CEM system downtime would incur allowance penalties. However, by instituting effective quality assurance programs and maintenance practices, availabilities of >98% became typical, negating the need for redundant systems, which were mostly removed and kept as spares. The key to these successes was in management providing the support and resources necessary to assure that the CEM data would be sufficiently accurate to back the allowance trades, where financial considerations could be substantial.
Allowance prices were relatively stable for about 10 years, hovering from approximately $150 to $200 per allowance from 1994 to 2004. Due to changes in regulatory policies (beginning with the Clean Air Interstate Rule and ending with the Cross‐State Air Pollution Rule), the closure of older coal‐fired facilities, and the increased usage of natural gas (which contains little sulfur), the market has essentially crashed, where SO 2allowances are readily available and are priced today at less than $1. However, the acid rain program led to a decrease in SO 2emissions in the power sector from 15.7 million tons per year in 1990 to below 1 million tons in 2019 ( Figure 2‐5).
The acid rain program succeeded in meeting and exceeding its original program objectives sooner than mandated. However, factors other than trading also contributed to the program’s success (Schmalensee and Stavins 2013, 2015). The availability of low‐sulfur coal from Montana and Wyoming, the means to transport coal across the West and Midwest, and emergence of natural gas as an alternative fuel to coal led to SO 2reductions that were not originally anticipated. Regardless of how the reductions were achieved, the constant factor in the program was highly accurate, reliable emissions data provided by the installed CEM systems. Accurate CEM data allowed the utilities to “keep score” with confidence, to weigh their operational and control options to cost‐effectively meet their regulatory obligations (Schreifels and Napolitano 2014).
The acid rain program serves as a template for other cap‐and‐trade programs, which is well documented by Schakenbach and Forte (2006). As viewed by Schakenbach et al., it is necessary that the monitoring and reporting procedures of the program be supported by effective quality control and quality assurance requirements. These requirements were at the time unique for a CEM regulatory program, incorporating elements such as the following:
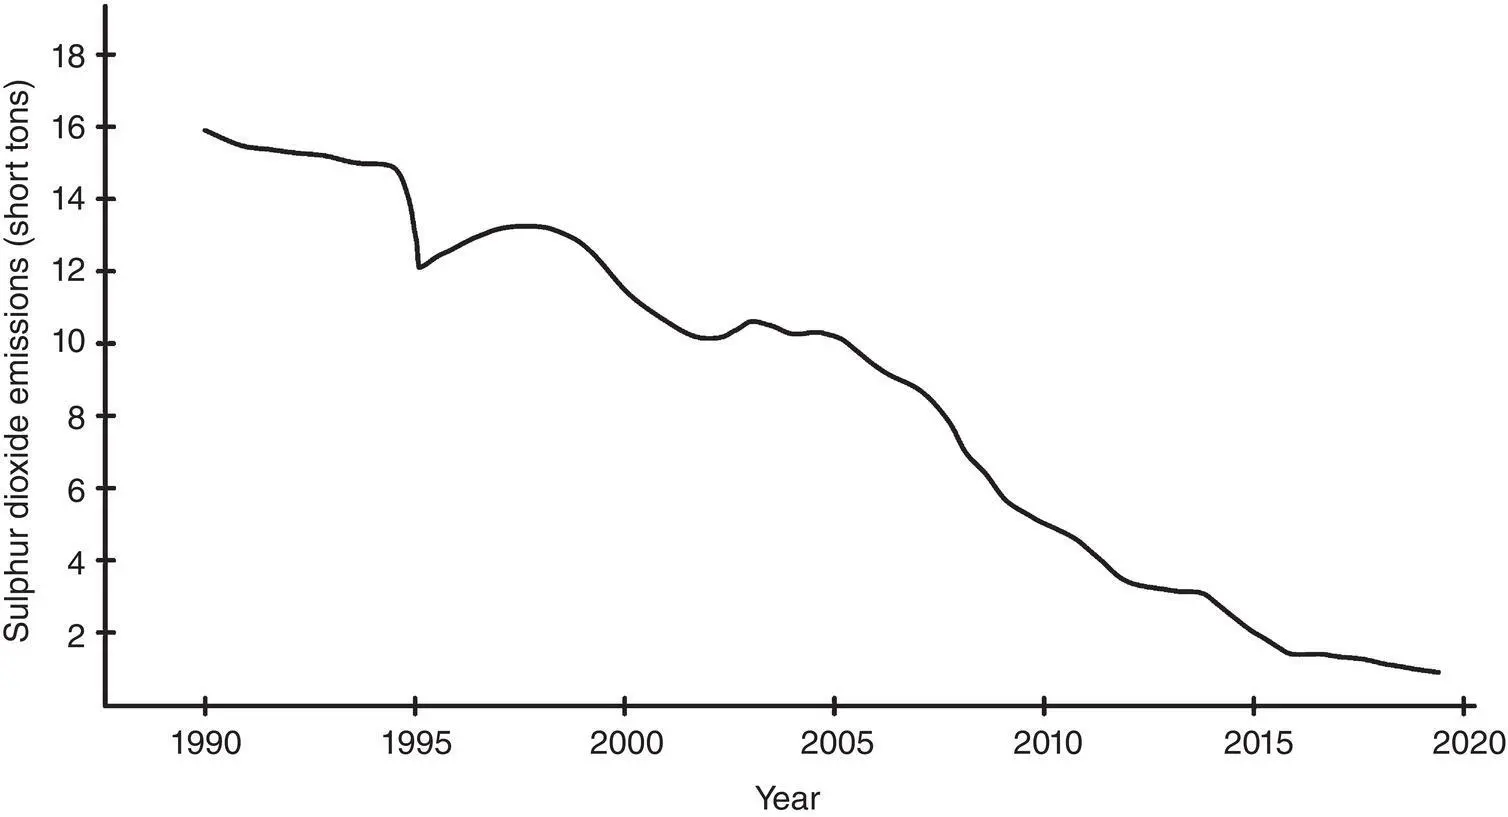
Figure 2‐5 U.S. utility sector SO 2emission reductions 1990–2019.
1 An implemented/effective CEM QA/QC plan
2 Incentives for good performance
3 Penalties for poor performance
4 Standardized electronic reporting formats and procedures
5 Electronic audits and data quality checking software
6 Targeted and random field performance and system audits
7 Flexibility for special circumstances and technical issues
8 Vigorous enforcement
These elements are further detailed in the Part 75 Subpart A – General Provisions (U.S. EPA 2020f). The Part 75 CEM requirements, for installation and certification, are found in Part 75 Appendix A(U.S. EPA 2020g), and quality assurance and quality control requirements are given in Appendix B(U.S. EPA 2020h). Other documents such as EPA’s Plain English Guide to the Part 75 Rule (U.S. EPA 2009), the Part 75 Emission Monitoring Technical Q and A document (U.S. EPA 2013), and the Part 75 CEMS Field Audit Manual (U.S. EPA 2003) are helpful in clarifying details of the Part 75 requirements.
The success of the acid rain program encouraged other cap‐and‐trade programs such as the EPA NO xBudget Program, the Regional Clean Air Incentives Market (RECLAIM) in California (discontinued), and the Houston‐Galveston HROVC (Highly Reactive Organic Compound) cap‐and‐trade program. In Canada, the province of Ontario has instituted a trading program for SO 2and NO x(Government of Ontario 2020b).
Trading programs have also been established for the control of greenhouse gases. In the United States, the Western Climate Initiative (WCI) in California (with Quebec as a partner) and the Regional Greenhouse Gas Initiative (RGGI) in the northeastern states. A U.S. Federal greenhouse gas trading program had been considered at one time, but no longer appears likely due to political polarization regarding climate change issues.
Mandatory Greenhouse Gas Reporting Program (40 CFR 98)
Forty‐two source categories, ranging from stationary fuel combustion sources to electronics manufacturing, emitting more than 25 000 metric tons of CO 2eper year are required as per 40 CFR 98 to report greenhouse gas emissions. Monitoring methods are specified in each of the 42 subparts; however, sources subject to Part 75 where CO 2monitors are already installed must use CEM system data for reporting. Hazardous waste incinerators with installed CO 2monitors must similarly report emissions using CEM system data. However, for most source categories, the reporting rule does not require the installation of continuous emission monitors, but allows the use of production data and emission factors instead.
Subpart C of Part 98 applies to stationary sources that combust fossil fuels. Here, a tier approach is taken, where each successive tier requires more measurements and the application of fewer emission factors, with the assumption that the higher the number of the tier, the higher the accuracy of the reported data. As an example of the use of emission factors, in Tiers 1 and 2, CO 2emissions are calculated from the following equation:
Читать дальшеИнтервал:
Закладка:
Похожие книги на «Continuous Emission Monitoring»
Представляем Вашему вниманию похожие книги на «Continuous Emission Monitoring» списком для выбора. Мы отобрали схожую по названию и смыслу литературу в надежде предоставить читателям больше вариантов отыскать новые, интересные, ещё непрочитанные произведения.


Обсуждение, отзывы о книге «Continuous Emission Monitoring» и просто собственные мнения читателей. Оставьте ваши комментарии, напишите, что Вы думаете о произведении, его смысле или главных героях. Укажите что конкретно понравилось, а что нет, и почему Вы так считаете.