Christopher Hallinan - Embedded Linux Primer - A Practical, Real-World Approach
Здесь есть возможность читать онлайн «Christopher Hallinan - Embedded Linux Primer - A Practical, Real-World Approach» весь текст электронной книги совершенно бесплатно (целиком полную версию без сокращений). В некоторых случаях можно слушать аудио, скачать через торрент в формате fb2 и присутствует краткое содержание. Год выпуска: 2006, ISBN: 2006, Издательство: Prentice Hall, Жанр: ОС и Сети, на английском языке. Описание произведения, (предисловие) а так же отзывы посетителей доступны на портале библиотеки ЛибКат.

- Название:Embedded Linux Primer: A Practical, Real-World Approach
- Автор:
- Издательство:Prentice Hall
- Жанр:
- Год:2006
- ISBN:978-0-13-167984-9
- Рейтинг книги:4 / 5. Голосов: 1
-
Избранное:Добавить в избранное
- Отзывы:
-
Ваша оценка:
Embedded Linux Primer: A Practical, Real-World Approach: краткое содержание, описание и аннотация
Предлагаем к чтению аннотацию, описание, краткое содержание или предисловие (зависит от того, что написал сам автор книги «Embedded Linux Primer: A Practical, Real-World Approach»). Если вы не нашли необходимую информацию о книге — напишите в комментариях, мы постараемся отыскать её.
This book brings together indispensable knowledge for building efficient, high-value, Linux-based embedded products: information that has never been assembled in one place before. Drawing on years of experience as an embedded Linux consultant and field application engineer, Christopher Hallinan offers solutions for the specific technical issues you're most likely to face, demonstrates how to build an effective embedded Linux environment, and shows how to use it as productively as possible.
Hallinan begins by touring a typical Linux-based embedded system, introducing key concepts and components, and calling attention to differences between Linux and traditional embedded environments. Writing from the embedded developer's viewpoint, he thoroughly addresses issues ranging from kernel building and initialization to bootloaders, device drivers to file systems.
Hallinan thoroughly covers the increasingly popular BusyBox utilities; presents a step-by-step walkthrough of porting Linux to custom boards; and introduces real-time configuration via CONFIG_RT--one of today's most exciting developments in embedded Linux. You'll find especially detailed coverage of using development tools to analyze and debug embedded systems--including the art of kernel debugging.
• Compare leading embedded Linux processors
• Understand the details of the Linux kernel initialization process
• Learn about the special role of bootloaders in embedded Linux systems, with specific emphasis on U-Boot
• Use embedded Linux file systems, including JFFS2--with detailed guidelines for building Flash-resident file system images
• Understand the Memory Technology Devices subsystem for flash (and other) memory devices
• Master gdb, KGDB, and hardware JTAG debugging
• Learn many tips and techniques for debugging within the Linux kernel
• Maximize your productivity in cross-development environments
• Prepare your entire development environment, including TFTP, DHCP, and NFS target servers
• Configure, build, and initialize BusyBox to support your unique requirements
Embedded Linux Primer: A Practical, Real-World Approach — читать онлайн бесплатно полную книгу (весь текст) целиком
Ниже представлен текст книги, разбитый по страницам. Система сохранения места последней прочитанной страницы, позволяет с удобством читать онлайн бесплатно книгу «Embedded Linux Primer: A Practical, Real-World Approach», без необходимости каждый раз заново искать на чём Вы остановились. Поставьте закладку, и сможете в любой момент перейти на страницу, на которой закончили чтение.
Интервал:
Закладка:
• Compilers use optimization techniques that complicate the correlation of C source to actual machine instruction flow. Inline functions are a good example of this.
• Single-stepping through compiler optimized code often produces unusual and unexpected results.
• Virtual memory isolates user space memory from kernel memory and can make various debugging scenarios especially difficult.
• Some code cannot be stepped through with traditional debuggers.
• Startup code can be especially difficult because of its proximity to the hardware and the limited resources available (for example, no console, limited memory mapping, and so on).
The Linux kernel has matured into a very high-performance operating system capable of competing with the best commercial operating systems. Many areas within the kernel do not lend themselves to easy analysis by simply reading the source code. Knowledge of the architecture and detailed design are often necessary to understand the code flow in a particular area. Several good books are available that describe the kernel design in detail. Refer to Section 14.6.1, "Suggestions for Additional Reading," for recommendations.
GCC is an optimizing compiler. By default, the Linux kernel is compiled with the -O2 compiler flag. This enables many optimization algorithms that can change the fundamental structure and order of your code. [89] See the GCC manual referenced at the end of this chapter in Section 14.6.1, "Suggestions for Additional Reading" for details on the optimization levels.
For example, the Linux kernel makes heavy use of inline functions. Inline functions are small functions declared with the inline keyword, which results in the function being included directly in the execution thread instead of generating a function call and the associated overhead. [90] Inline functions are like macros, but with the advantage of compile-time type checking.
Inline functions require a minimum of -O1 optimization level. Therefore, you cannot turn off optimization, which would be desirable for easier debugging.
In many areas within the Linux kernel, single-stepping through code is difficult or impossible. The most obvious examples are code paths that modify the virtual memory settings. When your application makes a system call that results in entry into the kernel, this results in a change in address space as seen by the process. In fact, any transition that involves a processor exception changes the operational context and can be difficult or impossible to single-step through.
14.2. Using KGDB for Kernel Debugging
Two popular methods enable symbolic source-level debugging within the Linux kernel:
• Using KGDB as a remote gdb agent
• Using a hardware JTAG probe to control the processor
We cover JTAG debugging in Section 14.4, "Hardware-Assisted Debugging."
KGDB (Kernel GDB) is a set of Linux kernel patches that provide an interface to gdb via its remote serial protocol. KGDB implements a gdb stub that communicates to a cross-gdb running on your host development workstation. Until very recently, KGDB on the target required a serial connection to the development host. Some targets support KGDB connection via Ethernet, although this is relatively new. Complete support for KGDB is still not in the mainline kernel.org kernel. You need to port KGDB to your chosen target or obtain an embedded Linux distribution for your chosen architecture and platform that contains KGDB support. Most embedded Linux distributions available today support KGDB.
Figure 14-1 describes the KGDB debug setup. Up to three connections to the target board are used. Ethernet is used to enable NFS root mount and telnet sessions from the host. If your board has a ramdisk image in Flash that it mounts as a root file system, you can eliminate the Ethernet connection.
Figure 14-1. KGDB debug setup
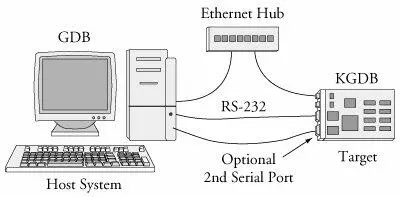
A serial port is dedicated for the connection between KGBD and gdb running on the development host system, and an optional second serial port serves as a console. Systems that have only one serial port make KGDB somewhat more cumbersome to use.
As you can see in Figure 14-1, the debugger (your cross-version of gdb) runs on your development host system. KGDB is part of the kernel running on your target system. KGDB implements the hooks required to interface gdb with your target board to enable features such as setting breakpoints, examining memory, and enabling single-step program execution.
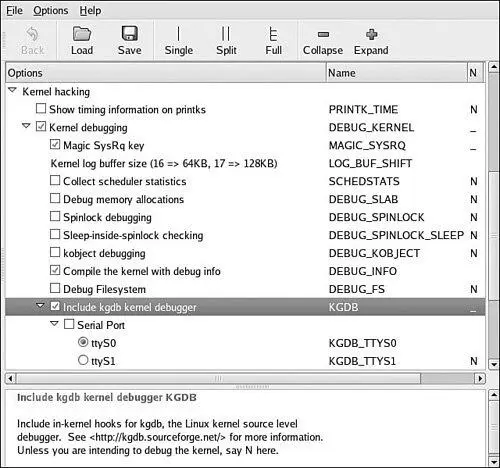
14.2.1. KGDB Kernel Configuration
KGDB is a kernel feature and must be enabled in your kernel. KGDB is selected from the Kernel Hacking menu, as shown in Figure 14-2. As part of the configuration, you must select the serial port for KGDB to use. Notice also from Figure 14-2 that we enabled the option to compile the kernel with debug information. This adds the -g compiler flag to the build process to enable symbolic debugging.
Figure 14-2. Kernel configuration for KGDB
14.2.2. Target Boot with KGDB Support
After your kernel is built with KGDB support, it must be enabled. Unfortunately, the method to enable it is not yet uniform across all architectures and implementations. In general, KGDB is enabled by passing a command line switch to the kernel via the kernel command line. If KGDB support is compiled into the kernel but not enabled via a command line switch, it does nothing. When KGDB is enabled, the kernel stops at a KGDB-enabled breakpoint very early in the boot cycle to allow you to connect to the target using gdb. Figure 14-3 shows the logic for generating an initial breakpoint when KGDB is enabled.
Figure 14-3. KGDB logic
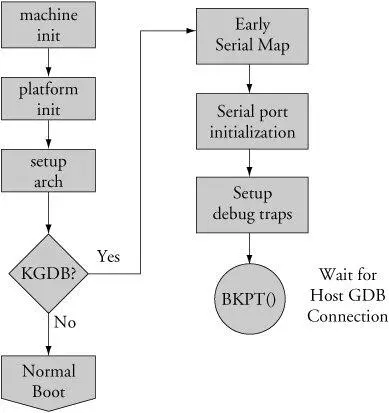
KGDB requires a serial port for connection to the host. [91] Notwithstanding the comments made earlier about KGDB over Ethernet.
The first step in setting up KGDB is to enable a serial port very early in the boot process. In many architectures, the hardware UART must be mapped into kernel memory before access. After the address range is mapped, the serial port is initialized. Debug trap handlers are installed to allow processor exceptions to trap into the debugger.
Listing 14-1 displays the terminal output when booting with KGDB enabled. This example is based on the AMCC 440EP Evaluation Kit (Yosemite board), which ships with the U-Boot bootloader.
Listing 14-1. Booting with KGDB Enabled Using U-Boot
=> sete bootargs console=ttyS1,115200 root=/dev/nfs rw ip=dhcp gdb
=> bootm 200000
## Booting image at 00200000 ...
Image Name: Linux-2.6.13
Image Type: PowerPC Linux Kernel Image (gzip compressed)
Data Size: 1064790 Bytes = 1 MB
Load Address: 00000000
Entry Point: 00000000
Verifying Checksum ... OK
Uncompressing Kernel Image ... OK
$T0440:c000ae5c;01:c0205fa0;#d9 <<< See text
Most of the boot sequence is familiar from our coverage of U-Boot in Chapter 7, "Bootloaders." This kernel boot sequence has two unique features: the command-line parameter to enable KGDB and the odd-looking text string after the kernel is uncompressed.
Читать дальшеИнтервал:
Закладка:
Похожие книги на «Embedded Linux Primer: A Practical, Real-World Approach»
Представляем Вашему вниманию похожие книги на «Embedded Linux Primer: A Practical, Real-World Approach» списком для выбора. Мы отобрали схожую по названию и смыслу литературу в надежде предоставить читателям больше вариантов отыскать новые, интересные, ещё непрочитанные произведения.


Обсуждение, отзывы о книге «Embedded Linux Primer: A Practical, Real-World Approach» и просто собственные мнения читателей. Оставьте ваши комментарии, напишите, что Вы думаете о произведении, его смысле или главных героях. Укажите что конкретно понравилось, а что нет, и почему Вы так считаете.