Christopher Hallinan - Embedded Linux Primer - A Practical, Real-World Approach
Здесь есть возможность читать онлайн «Christopher Hallinan - Embedded Linux Primer - A Practical, Real-World Approach» весь текст электронной книги совершенно бесплатно (целиком полную версию без сокращений). В некоторых случаях можно слушать аудио, скачать через торрент в формате fb2 и присутствует краткое содержание. Год выпуска: 2006, ISBN: 2006, Издательство: Prentice Hall, Жанр: ОС и Сети, на английском языке. Описание произведения, (предисловие) а так же отзывы посетителей доступны на портале библиотеки ЛибКат.

- Название:Embedded Linux Primer: A Practical, Real-World Approach
- Автор:
- Издательство:Prentice Hall
- Жанр:
- Год:2006
- ISBN:978-0-13-167984-9
- Рейтинг книги:4 / 5. Голосов: 1
-
Избранное:Добавить в избранное
- Отзывы:
-
Ваша оценка:
Embedded Linux Primer: A Practical, Real-World Approach: краткое содержание, описание и аннотация
Предлагаем к чтению аннотацию, описание, краткое содержание или предисловие (зависит от того, что написал сам автор книги «Embedded Linux Primer: A Practical, Real-World Approach»). Если вы не нашли необходимую информацию о книге — напишите в комментариях, мы постараемся отыскать её.
This book brings together indispensable knowledge for building efficient, high-value, Linux-based embedded products: information that has never been assembled in one place before. Drawing on years of experience as an embedded Linux consultant and field application engineer, Christopher Hallinan offers solutions for the specific technical issues you're most likely to face, demonstrates how to build an effective embedded Linux environment, and shows how to use it as productively as possible.
Hallinan begins by touring a typical Linux-based embedded system, introducing key concepts and components, and calling attention to differences between Linux and traditional embedded environments. Writing from the embedded developer's viewpoint, he thoroughly addresses issues ranging from kernel building and initialization to bootloaders, device drivers to file systems.
Hallinan thoroughly covers the increasingly popular BusyBox utilities; presents a step-by-step walkthrough of porting Linux to custom boards; and introduces real-time configuration via CONFIG_RT--one of today's most exciting developments in embedded Linux. You'll find especially detailed coverage of using development tools to analyze and debug embedded systems--including the art of kernel debugging.
• Compare leading embedded Linux processors
• Understand the details of the Linux kernel initialization process
• Learn about the special role of bootloaders in embedded Linux systems, with specific emphasis on U-Boot
• Use embedded Linux file systems, including JFFS2--with detailed guidelines for building Flash-resident file system images
• Understand the Memory Technology Devices subsystem for flash (and other) memory devices
• Master gdb, KGDB, and hardware JTAG debugging
• Learn many tips and techniques for debugging within the Linux kernel
• Maximize your productivity in cross-development environments
• Prepare your entire development environment, including TFTP, DHCP, and NFS target servers
• Configure, build, and initialize BusyBox to support your unique requirements
Embedded Linux Primer: A Practical, Real-World Approach — читать онлайн бесплатно полную книгу (весь текст) целиком
Ниже представлен текст книги, разбитый по страницам. Система сохранения места последней прочитанной страницы, позволяет с удобством читать онлайн бесплатно книгу «Embedded Linux Primer: A Practical, Real-World Approach», без необходимости каждый раз заново искать на чём Вы остановились. Поставьте закладку, и сможете в любой момент перейти на страницу, на которой закончили чтение.
Интервал:
Закладка:
2592: 4002: max alloced with 1 call: 376 bytes
2592: 4002: max unused memory space: 37542 bytes (57%)
2592: 4002: top 10 allocations:
2592: 4002: total-size count in-use-size count source
2592: 4002: 16000 1000 32 2 mtest_ex.c:36
2592: 4002: 10890 1000 20 2 mtest_ex.c:74
2592: 4002: 256 1 0 0 mtest_ex.c:154
2592: 4002: 27146 2001 52 4 Total of 3
2592: 4002: Dumping Not-Freed Pointers Changed Since Start:
2592: 4002: not freed: '0x300204e8|s1' (10 bytes) from 'mtest_ex.c:74'
2592: 4002: not freed: '0x30020588|s1' (16 bytes) from 'mtest_ex.c:36'
2592: 4002: not freed: '0x30020688|s1' (16 bytes) from 'mtest_ex.c:36'
2592: 4002: not freed: '0x300208a8|s1' (10 bytes) from 'mtest_ex.c:74'
2592: 4002: total-size count source
2592: 4002: 32 2 mtest_ex.c:36
2592: 4002: 20 2 mtest_ex.c:74
2592: 4002: 52 4 Total of 2
2592: 4002: ending time = 2592, elapsed since start = 0:00:00
It is important to note that this log is generated upon program exit. (dmalloc has many options and modes of operation; it is possible to configure dmalloc to print output lines when errors are detected.)
The first half of the output log reports high-level statistics about the heap and the overall memory usage of the application. Totals are produced for each of the malloc library calls, such as malloc(), free(), and realloc(). Interestingly, this default log reports on the top 10 allocations and the source location where they occurred. This can be very useful for overall system-level profiling.
Toward the end of the log, we see evidence of memory leaks in our application. You can see that the dmalloc library detected four instances of memory that was allocated that was apparently never freed. Because we included dmalloc.h and compiled with debug symbols, the source location where the memory was allocated is indicated in the log.
As with the other tools we've covered in this chapter, space permits only a brief introduction of this very powerful debug tool. dmalloc can detect many other conditions and limits. For example, dmalloc can detect when a freed pointer has been written. It can tell whether a pointer was used to access data outside its bounds but within the application's permissible address range. In fact, dmalloc can be configured to log almost any memory transaction through the malloc family of calls. dmalloc is a tool that is sure to pay back many times the effort taken to become proficient with it.
13.4.8. Kernel Oops
Although not strictly a tool, a kernel oops contains much useful information to help you troubleshoot the cause. A kernel oops results from a variety of kernel errors from simple memory errors produced by a process (fully recoverable, in most cases) to a hard kernel panic. Recent Linux kernels support display of symbolic information in addition to the raw hexadecimal address values. Listing 13-14 reproduces a kernel oops from a PowerPC target.
Listing 13-14. Kernel Oops
$ modprobe loop
Oops: kernel access of bad area, sig: 11 [#1]
NIP: C000D058 LR: C0085650 SP: C7787E80 REGS: c7787dd0 TRAP: 0300 Not tainted
MSR: 00009032 EE: 1 PR: 0 FP: 0 ME: 1 IR/DR: 11
DAR: 00000000, DSISR: 22000000
TASK = c7d187b0[323] 'modprobe' THREAD: c7786000
Last syscall: 128
GPR00: 0000006C C7787E80 C7D187B0 00000000 C7CD25CC FFFFFFFF 00000000 80808081
GPR08: 00000001 C034AD80 C036D41C C034AD80 C0335AB0 1001E3C0 00000000 00000000
GPR16: 00000000 00000000 00000000 100170D8 100013E0 C9040000 C903DFD8 C9040000
GPR24: 00000000 C9040000 C9040000 00000940 C778A000 C7CD25C0 C7CD25C0 C7CD25CC
NIP [c000d058] strcpy+0x10/0x1c
LR [c0085650] register_disk+0xec/0xf0
Call trace:
[c00e170c] add_disk+0x58/0x74
[c90061e0] loop_init+0x1e0/0x430 [loop]
[c002fc90] sys_init_module+0x1f4/0x2e0
[c00040a0] ret_from_syscall+0x0/0x44
Segmentation fault
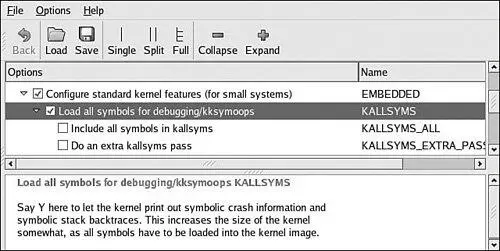
Notice that the register dump includes symbolic information, where appropriate. Your kernel must have KALLSYSMS enabled for this symbolic information to be available. Figure 13-4 shows the configuration options under the General Setup main menu.
Figure 13-4. Symbol support for oops
Much of the information in a kernel oops message is directly related to the processor. Having some knowledge of the underlying architecture is necessary to fully understand the oops message.
Analyzing the oops in Listing 13-14, we see right away that the oops was generated due to a "kernel access of bad area, sig: 11". We already know from previous examples in this chapter that signal 11 is a segmentation fault.
The first section is a summary showing the reason for the oops, a few important pointers, and the offending task. In Listing 13-14, NIP is the next instruction pointer, which is decoded later in the oops message. This points to the offending code that led to the oops. LR is a PowerPC register and usually indicates the return address for the currently executing subroutine. SP is the stack pointer. REGS indicates the kernel address for the data structure containing the register dump data, and TRAP indicates the type of exception that this oops message relates to. Referring to the PowerPC architecture reference manual referenced at the end of Chapter 7, "Bootloaders," we see that a TRAP 0300 is the PowerPC Data Storage Interrupt, which is triggered by a data memory access error.
On the third line of the oops message, we see additional PowerPC machine registers, such as MSR (machine state register) and a decode of some of its bits. On the next line, we see the DAR (data access register), which often contains the offending memory address. The DSISR register contents can be used in conjunction with the PowerPC architecture reference to discover much detail about the specific reason for the exception.
An oops message also contains the task pointer and the decoded task name to quickly determine what task or thread was running at the time of the oops. We also see a detailed processor register dump, which can be used for additional clues. Again, we need knowledge of the architecture and compiler register usage to make sense of the clues from the register values. For example, the PowerPC architecture uses the r3 register for return values from C functions.
The last part of the oops message provides a stack backtrace with symbol decode if symbols are enabled in the kernel. Using this information, we can construct a sequence of events that led to the offending condition.
In this simple example, we have learned a great deal of information from this oops message. We know that it was a PowerPC Data Storage Exception, caused by an error in a data memory access (as opposed to an instruction fetch memory access). The DAR register tells us that the data address that generated this exception was 0x0000_0000. We know that the modprobe process produced the error. From the backtrace and NIP (next instruction pointer), we know that it was in a call to strcpy() that can be traced directly back to the loop_init() function in the loop.ko module, which modprobe was trying to insert at the time of the exception. Given this information, tracking down the source of this errant null pointer dereference should be quite trivial.
Читать дальшеИнтервал:
Закладка:
Похожие книги на «Embedded Linux Primer: A Practical, Real-World Approach»
Представляем Вашему вниманию похожие книги на «Embedded Linux Primer: A Practical, Real-World Approach» списком для выбора. Мы отобрали схожую по названию и смыслу литературу в надежде предоставить читателям больше вариантов отыскать новые, интересные, ещё непрочитанные произведения.


Обсуждение, отзывы о книге «Embedded Linux Primer: A Practical, Real-World Approach» и просто собственные мнения читателей. Оставьте ваши комментарии, напишите, что Вы думаете о произведении, его смысле или главных героях. Укажите что конкретно понравилось, а что нет, и почему Вы так считаете.