Christopher Hallinan - Embedded Linux Primer - A Practical, Real-World Approach
Здесь есть возможность читать онлайн «Christopher Hallinan - Embedded Linux Primer - A Practical, Real-World Approach» весь текст электронной книги совершенно бесплатно (целиком полную версию без сокращений). В некоторых случаях можно слушать аудио, скачать через торрент в формате fb2 и присутствует краткое содержание. Год выпуска: 2006, ISBN: 2006, Издательство: Prentice Hall, Жанр: ОС и Сети, на английском языке. Описание произведения, (предисловие) а так же отзывы посетителей доступны на портале библиотеки ЛибКат.

- Название:Embedded Linux Primer: A Practical, Real-World Approach
- Автор:
- Издательство:Prentice Hall
- Жанр:
- Год:2006
- ISBN:978-0-13-167984-9
- Рейтинг книги:4 / 5. Голосов: 1
-
Избранное:Добавить в избранное
- Отзывы:
-
Ваша оценка:
Embedded Linux Primer: A Practical, Real-World Approach: краткое содержание, описание и аннотация
Предлагаем к чтению аннотацию, описание, краткое содержание или предисловие (зависит от того, что написал сам автор книги «Embedded Linux Primer: A Practical, Real-World Approach»). Если вы не нашли необходимую информацию о книге — напишите в комментариях, мы постараемся отыскать её.
This book brings together indispensable knowledge for building efficient, high-value, Linux-based embedded products: information that has never been assembled in one place before. Drawing on years of experience as an embedded Linux consultant and field application engineer, Christopher Hallinan offers solutions for the specific technical issues you're most likely to face, demonstrates how to build an effective embedded Linux environment, and shows how to use it as productively as possible.
Hallinan begins by touring a typical Linux-based embedded system, introducing key concepts and components, and calling attention to differences between Linux and traditional embedded environments. Writing from the embedded developer's viewpoint, he thoroughly addresses issues ranging from kernel building and initialization to bootloaders, device drivers to file systems.
Hallinan thoroughly covers the increasingly popular BusyBox utilities; presents a step-by-step walkthrough of porting Linux to custom boards; and introduces real-time configuration via CONFIG_RT--one of today's most exciting developments in embedded Linux. You'll find especially detailed coverage of using development tools to analyze and debug embedded systems--including the art of kernel debugging.
• Compare leading embedded Linux processors
• Understand the details of the Linux kernel initialization process
• Learn about the special role of bootloaders in embedded Linux systems, with specific emphasis on U-Boot
• Use embedded Linux file systems, including JFFS2--with detailed guidelines for building Flash-resident file system images
• Understand the Memory Technology Devices subsystem for flash (and other) memory devices
• Master gdb, KGDB, and hardware JTAG debugging
• Learn many tips and techniques for debugging within the Linux kernel
• Maximize your productivity in cross-development environments
• Prepare your entire development environment, including TFTP, DHCP, and NFS target servers
• Configure, build, and initialize BusyBox to support your unique requirements
Embedded Linux Primer: A Practical, Real-World Approach — читать онлайн бесплатно полную книгу (весь текст) целиком
Ниже представлен текст книги, разбитый по страницам. Система сохранения места последней прочитанной страницы, позволяет с удобством читать онлайн бесплатно книгу «Embedded Linux Primer: A Practical, Real-World Approach», без необходимости каждый раз заново искать на чём Вы остановились. Поставьте закладку, и сможете в любой момент перейти на страницу, на которой закончили чтение.
Интервал:
Закладка:
Figure 13-1. Data Display Debugger
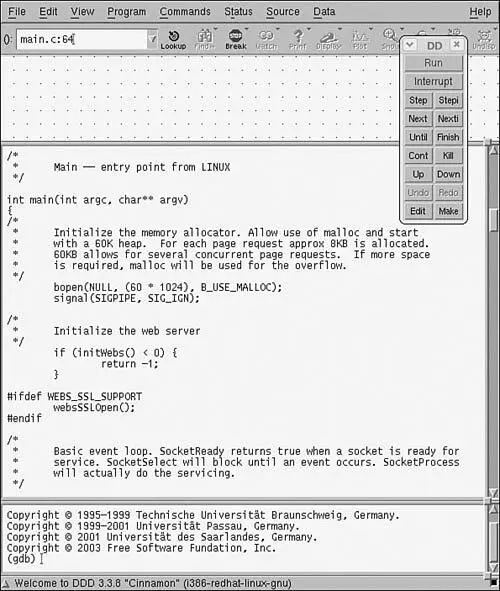
DDD is invoked as follows:
$ ddd --debugger xscale_be-gdb webs
Without the --debugger flag, DDD would attempt to invoke the native GDB on your development host, which is not what you want if you are planning to debug an application on your target system. The second argument on the DDD command line is the program you will be debugging. See the man page for DDD for additional details.
Using the command tool as shown in Figure 13-1, you can step through your program. You can set breakpoints either graphically or via the GDB console window at the bottom of the DDD screen. For target debugging, you must first connect your debugger to the target system as we did in Listing 13-4, using the target command. This command is issued in the GDB window of the ddd main screen.
When you are connected to the target, you can execute similar commands to the sequence described in the previous example to isolate the program failure. Figure 13-2 shows the DDD display during the later phase of this debugging session.
Figure 13-2. Debug session in DDD
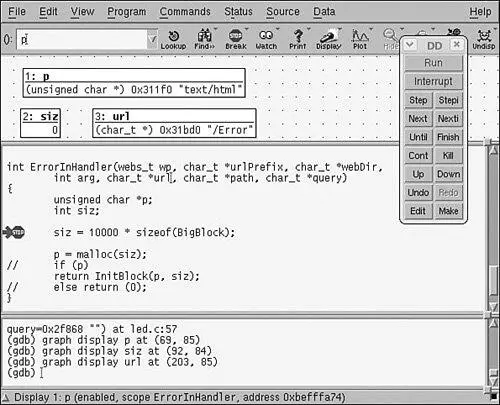
Notice that in Figure 13-2 we have initiated the display of some important program variables that can help us narrow the cause of the segmentation fault. We can watch these variables as we step through the program using the command tool shown in the figure.
DDD is a powerful graphical front end for GDB. It is relatively easy to use and widely supported for many development hosts. Consult Section 13.7.1 at the end of this chapter for a link to the GNU DDD documentation.
13.3. cbrowser/cscope
We mention cbrowser here because support for this handy tool has found its way into the Linux kernel source tree. [82] Actually, support for the underlying engine that cbrowser uses is in the Linux build system.
cbrowser is a simple source-code browsing tool that makes it easy to bounce around a large source tree following symbols.
The Linux kernel makefile supports building the database that cbrowser uses. Here is an example invocation from a recent Linux kernel snapshot:
$ make ARCH=ppc CROSS_COMPILE=ppc_82xx- cscope
This produces the cscope symbol database that cbrowser uses. cscope is the engine; cbrowser is the graphical user interface. You can use cscope on its own if you want. It is command line driven and very powerful, but not quite as quick or easy for navigating a large source tree in this point-and-click era. If vi is still your favorite editor, cscope might be just for you!
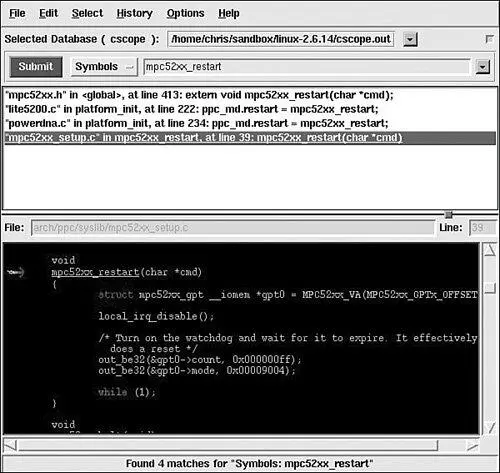
To invoke cbrowser, enter the directory that contains your cscope database, and simply type the cbrowser command without arguments. Figure 13-3 shows an example session. You can read more about both of these useful tools in the references listed in Section 13.7.1 at the end of this chapter.
Figure 13-3. cbrowser in action
13.4. Tracing and Profiling Tools
Many useful tools can provide you with various views of the system. Some tools offer a high-level perspective, such as what processes are running on your system and which processes are consuming the most CPU bandwidth. Other tools can provide detailed analysis, such as where memory is being allocated or, even more useful, where it is being leaked. The next few sections introduce the most important tools and utilities in this category. We have space for only a cursory introduction to these tools; references are provided where appropriate if you want more details.
13.4.1. strace
This useful system trace utility is found in virtually all Linux distributions. strace captures and displays useful information for every kernel system call executed by a Linux application program. strace is especially handy because it can be run on programs for which no source code is available. It is not necessary to compile the program with debug symbols as it is with GDB. Furthermore, strace can be a very insightful educational tool. As the man page states, "Students, hackers and the overly-curious will find that a great deal can be learned about a system and its system calls by tracing even ordinary programs."
While preparing the example software for the GDB section earlier in this chapter, I decided to use a software project unfamiliar to me, an early version of the GoAhead web server. The first attempt at compiling and linking the project led to an interesting example for strace. Starting the application from the command line silently returned control back to the console. No error messages were produced, and a look into the system logs also produced no clues! It simply would not run.
strace quickly identified the problem. The output from invoking strace on this software package is produced in Listing 13-5. Many lines from this output have been deleted due to space considerations. The unedited output is over one hundred lines long.
Listing 13-5. [83] See man ldconfig for details on creating a linker cache for your target system.
strace Output: GoAhead Web Demo
01 root@coyote:/home/websdemo$ strace ./websdemo
02 execve("./websdemo", ["./websdemo"], [/* 14 vars */]) = 0
03 uname({sys="Linux", node="coyote", ...}) = 0
04 brk(0) = 0x10031050
05 open("/etc/ld.so.preload", O_RDONLY) = -1 ENOENT (No such file or directory)
06 open("/etc/ld.so.cache", O_RDONLY) = -1 ENOENT (No such file or directory)
07 open("/lib/libc.so.6", O_RDONLY) = 3
08 read(3, "\177ELF\1\2\1\0\0\0\0\0\0\0\0\0\0\3\0\24\0\0\0\1\0\1\322"..., 1024) = 1024
09 fstat64(0x3, 0x7fffefc8) = 0
10 mmap(0xfe9f000, 1379388, PROT_READ|PROT_EXEC, MAP_PRIVATE, 3, 0) = 0xfe9f000
11 mprotect(0xffd8000, 97340, PROT_NONE) = 0
12 mmap(0xffdf000, 61440, PROT_READ|PROT_WRITE|PROT_EXEC,MAP_PRIVATE|MAP_FIXED, 3, 0x130000) = 0xffdf000
13 mmap(0xffee000, 7228, PROT_READ|PROT_WRITE|PROT_EXEC, MAP_PRIVATE|MAP_FIXED|MAP_ANONYMOUS, -1, 0) = 0xffee000
14 close(3) = 0
15 brk(0) = 0x10031050
16 brk(0x10032050) = 0x10032050
17 brk(0x10033000) = 0x10033000
18 brk(0x10041000) = 0x10041000
19 rt_sigaction(SIGPIPE, {SIG_IGN}, {SIG_DFL}, 8) = 0
20 stat("./umconfig.txt", 0x7ffff9b8) = -1 ENOENT (No such file or directory)
21 uname({sys="Linux", node="coyote", ...}) = 0
22 gettimeofday({3301, 178955}, NULL) = 0
23 getpid() = 156
24 open("/etc/resolv.conf", O_RDONLY) = 3
25 fstat64(0x3, 0x7fffd7f8) = 0
26 mmap(NULL, 4096, PROT_READ|PROT_WRITE, MAP_PRIVATE|MAP_ANONYMOUS, -1, 0) = 0x30017000
27 read(3, "#\n# resolv.conf This file is th"..., 4096) = 83
28 read(3, "", 4096) = 0
29 close(3) = 0
... <<< Lines 30-81 removed for brevity
82 socket(PF_INET, SOCK_DGRAM, IPPROTO_IP) = 3
83 connect(3, {sa_family=AF_INET, sin_port=htons(53), sin_addr=inet_addr("0.0.0.0")}, 28) = 0
Интервал:
Закладка:
Похожие книги на «Embedded Linux Primer: A Practical, Real-World Approach»
Представляем Вашему вниманию похожие книги на «Embedded Linux Primer: A Practical, Real-World Approach» списком для выбора. Мы отобрали схожую по названию и смыслу литературу в надежде предоставить читателям больше вариантов отыскать новые, интересные, ещё непрочитанные произведения.


Обсуждение, отзывы о книге «Embedded Linux Primer: A Practical, Real-World Approach» и просто собственные мнения читателей. Оставьте ваши комментарии, напишите, что Вы думаете о произведении, его смысле или главных героях. Укажите что конкретно понравилось, а что нет, и почему Вы так считаете.