Andrew Hudson - Fedora™ Unleashed, 2008 edition
Здесь есть возможность читать онлайн «Andrew Hudson - Fedora™ Unleashed, 2008 edition» весь текст электронной книги совершенно бесплатно (целиком полную версию без сокращений). В некоторых случаях можно слушать аудио, скачать через торрент в формате fb2 и присутствует краткое содержание. Город: Indianapolis, Год выпуска: 2008, ISBN: 2008, Издательство: Sams Publishing, Жанр: ОС и Сети, на английском языке. Описание произведения, (предисловие) а так же отзывы посетителей доступны на портале библиотеки ЛибКат.
- Название:Fedora™ Unleashed, 2008 edition
- Автор:
- Издательство:Sams Publishing
- Жанр:
- Год:2008
- Город:Indianapolis
- ISBN:978-0-672-32977-7
- Рейтинг книги:5 / 5. Голосов: 1
-
Избранное:Добавить в избранное
- Отзывы:
-
Ваша оценка:
Fedora™ Unleashed, 2008 edition: краткое содержание, описание и аннотация
Предлагаем к чтению аннотацию, описание, краткое содержание или предисловие (зависит от того, что написал сам автор книги «Fedora™ Unleashed, 2008 edition»). Если вы не нашли необходимую информацию о книге — напишите в комментариях, мы постараемся отыскать её.
Finding information you need is not always easy. This short index provides a list of common tasks discussed inside this book. Browse the table of contents or index for detailed listings and consult the specified chapter for in-depth discussions about each subject.
left How Do I…?
See…
How Do I…?
See…
left Back up my system?
Chapter 13
Partition a hard drive?
Appendix B, Chapters 1, 35
left Build a new Linux kernel?
Chapter 36
Play MP3s and other music?
Chapter 7
left Burn a CD?
Chapter 7
Print a file?
Chapter 8
left Change a password?
Chapter 4
Read a text file?
Chapter 4
left Change the date and time?
Chapter 32
Read or send email?
Chapter 21
left Compress a file?
Chapter 13
Read or post to newsgroups?
Chapter 5
left Configure a modem?
Chapter 2
Reboot Fedora?
Chapter 1
left Configure a printer?
Chapter 8
Rescue my system?
Chapter 13
left Configure a scanner?
Chapter 7
Set up a DNS server?
Chapter 23
left Configure a sound card?
Chapter 7
Set up a firewall?
Chapter 14
left Configure my desktop settings?
Chapter 3
Set up a web server?
Chapter 15
left Connect to the Internet?
Chapter 5
Set up an FTP server?
Chapter 20
left Control a network interface?
Chapter 14
Set up Samba with SWAT?
Chapter 19
left Copy files or directories?
Chapters 13, 32
Set up wireless networking?
Chapter 14
left Create a boot disk to boot Fedora?
Chapter 1
Shut down Fedora?
Chapter 1
left Create a database?
Chapter 16
Use a spreadsheet?
Chapter 6
left Create a user?
Chapter 4
Use Instant Messaging?
Chapter 5
left Delete a file or directory?
Chapter 32
Watch television on my computer?
Chapter 7
left Get images from a digital camera?
Chapter 7
Edit a text file?
Chapter 4
left Install Fedora?
Chapter 1
Make Fedora more secure?
Chapter 14
left Log in to Fedora?
Chapter 1
Mount a CD-ROM or hard drive?
Chapter 35
Fedora™ Unleashed, 2008 edition — читать онлайн бесплатно полную книгу (весь текст) целиком
Ниже представлен текст книги, разбитый по страницам. Система сохранения места последней прочитанной страницы, позволяет с удобством читать онлайн бесплатно книгу «Fedora™ Unleashed, 2008 edition», без необходимости каждый раз заново искать на чём Вы остановились. Поставьте закладку, и сможете в любой момент перейти на страницу, на которой закончили чтение.
Интервал:
Закладка:
The nicecommand is used with its -noption, along with an argument in the range of -20to 19, in order from highest to lowest priority (the lower the number, the higher the priority). For example, to run the gkrellmclient with a low priority, use the nicecommand like this:
$ nice -n 12 gkrellm &
The nicecommand is typically used for disk- or CPU-intensive tasks that might be obtrusive or cause system slowdown. The renicecommand can be used to reset the priority of running processes or control the priority and scheduling of all processes owned by a user. Regular users can only numerically increase process priorities (that is, make tasks less important) with this command, but the root operator can use the full nicerange of scheduling (- 20to 19).
System administrators can also use the timecommand to get an idea of how much time and what proportion of a system's resources are required for a task, such as a shell script. (Here, timeis used to measure the duration of elapsed time; the command that deals with civil and sidereal time is the datecommand.) This command is used with the name of another command (or script) as an argument like this:
# time -p find / -name core -print
/dev/core
/proc/sys/net/core
real 1.20
user 0.14
sys 0.71
Output of the command displays the time from start to finish, along with the user and system time required. Other factors you can query include memory, CPU use, and file system input/output (I/O) statistics. See the timecommand's man page for more details.
Nearly all graphical process-monitoring tools include some form of process control or management. Many of the early tools ported to Linux were clones of legacy UNIX utilities. One familiar monitoring (and control) program is top. Based on the pscommand, the topcommand provides a text-based display of constantly updated console-based output showing the most CPU-intensive processes currently running. It can be started like this:
# top
After you press Enter, you see a display as shown in Figure 12.1. The topcommand has a few interactive commands: Pressing h displays the help screen; pressing k prompts you to enter the PID of a process to kill; pressing n prompts you to enter the PID of a process to change its nicevalue. The topman page describes other commands and includes a detailed description of what all the columns of information topcan display actually represent; have a look at top's well-written manpage.
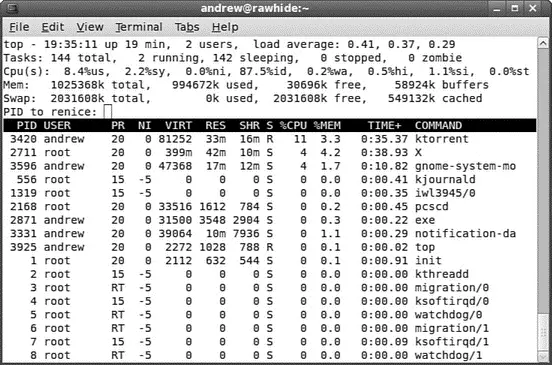
FIGURE 12.1 The topcommand can be used to monitor and control processes. Here, we are prompted to renicea process.
The topcommand displays quite a bit of information about your system. Processes can be sorted by PID, age, CPU or memory use, time, or user. This command also provides process management, and system administrators can use its kand rkeypress commands to kill and reschedule running tasks, respectively.
The topcommand uses a fair amount of memory, so you might want to be judicious in its use and not leave it running all the time. When you've finished with it, simply press qto quit top.
Displaying Free and Used Memory with free
Although top includes some memory information, the free utility displays the amount of free and used memory in the system in kilobytes (the -m switch displays in megabytes). On one system, the output looks like this:
# free
total used free shared buffers cached
Mem: 1025368 995860 29508 0 56472 551464
-/+ buffers/cache: 387924 637444
Swap: 2031608 0 2031608
Swap: 433712 0 433712
This output describes a machine with 1GB of RAM memory and a swap partition of 2GB. Note that no swap is being used, although the machine is heavily loaded. Linux is very good at memory management and "grabs" all the memory it can in anticipation of future work.
A useful trick is to employ the watchcommand; it repeatedly reruns a command every 2 seconds by default. If you use
# watch free
you can see the output of the free command updated every 2 seconds.
Another useful system-monitoring tool is vmstat( virtual memory statistics ). This command reports on processes, memory, I/O, and CPU, typically providing an average since the last reboot; or you can make it report use for a current period by telling it the time interval in seconds and the number of iterations you desire, as follows:
# vmstat 5 10
The preceding command runs vmstatevery 5 seconds for 10 iterations.
Use the uptimecommand to see how long it has been since the last reboot and to get an idea of what the load average has been; higher numbers mean higher loads.
Disk Quotas
Disk quotas are a way to restrict the use of disk space either by user or by groups. Although rarely — if ever — used on a local or standalone workstation, quotas are definitely a way of life at the enterprise level of computing. Use limits on disk space not only conserve resources, but also provide a measure of operational safety by limiting the amount of disk space any user can consume.
Disk quotas are more fully covered in Chapter 10, "Managing Users."
Graphical Process and System Management Tools
The GNOME and KDE desktop environments offer a rich set of network and system- monitoring tools. Graphical interface elements, such as menus and buttons, and graphical output, including metering and real-time load charts, make these tools easy to use. These clients, which require an active X session and (in some cases) root permission, are included with Fedora.
If you view the graphical tools locally while they are being run on a server, you must have X properly installed and configured on your local machine. Although some tools can be used to remotely monitor systems or locally mounted remote file systems, you have to properly configure pertinent X11 environment variables, such as $DISPLAY, to use the software or use the sshclient's - Xoption when connecting to the remote host.
Fedora no longer includes the xosviewclient, which provided load, CPU, memory and swap use, disk I/O use and activity, page-swapping information, network activity, I/O activity, I/O rates, serial port status, and if APM is enabled, the battery level (such as for a laptop). However, a great replacement is GKrellM, which provides a much neater interface and a host of additional plug-ins. You have to use this command to retrieve GKrellM:
# yum install gkrellm
After you have installed GKrellM, you can find it under Applications, System Tools. Figure 12.2 shows GKrellM.
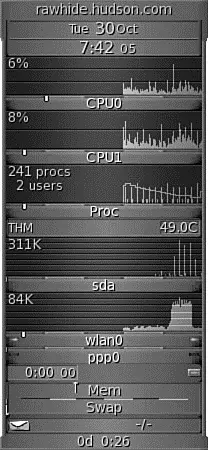
FIGURE 12.2 GKrellM allows you to monitor most system processes on Fedora.
Читать дальшеИнтервал:
Закладка:
Похожие книги на «Fedora™ Unleashed, 2008 edition»
Представляем Вашему вниманию похожие книги на «Fedora™ Unleashed, 2008 edition» списком для выбора. Мы отобрали схожую по названию и смыслу литературу в надежде предоставить читателям больше вариантов отыскать новые, интересные, ещё непрочитанные произведения.


![Andrew Radford - Linguistics An Introduction [Second Edition]](/books/397851/andrew-radford-linguistics-an-introduction-second-thumb.webp)


Обсуждение, отзывы о книге «Fedora™ Unleashed, 2008 edition» и просто собственные мнения читателей. Оставьте ваши комментарии, напишите, что Вы думаете о произведении, его смысле или главных героях. Укажите что конкретно понравилось, а что нет, и почему Вы так считаете.