R. Murton - Collins New Naturalist Library
Здесь есть возможность читать онлайн «R. Murton - Collins New Naturalist Library» — ознакомительный отрывок электронной книги совершенно бесплатно, а после прочтения отрывка купить полную версию. В некоторых случаях можно слушать аудио, скачать через торрент в формате fb2 и присутствует краткое содержание. Жанр: unrecognised, на английском языке. Описание произведения, (предисловие) а так же отзывы посетителей доступны на портале библиотеки ЛибКат.

- Название:Collins New Naturalist Library
- Автор:
- Жанр:
- Год:неизвестен
- ISBN:нет данных
- Рейтинг книги:4 / 5. Голосов: 1
-
Избранное:Добавить в избранное
- Отзывы:
-
Ваша оценка:
Collins New Naturalist Library: краткое содержание, описание и аннотация
Предлагаем к чтению аннотацию, описание, краткое содержание или предисловие (зависит от того, что написал сам автор книги «Collins New Naturalist Library»). Если вы не нашли необходимую информацию о книге — напишите в комментариях, мы постараемся отыскать её.
Collins New Naturalist Library — читать онлайн ознакомительный отрывок
Ниже представлен текст книги, разбитый по страницам. Система сохранения места последней прочитанной страницы, позволяет с удобством читать онлайн бесплатно книгу «Collins New Naturalist Library», без необходимости каждый раз заново искать на чём Вы остановились. Поставьте закладку, и сможете в любой момент перейти на страницу, на которой закончили чтение.
Интервал:
Закладка:
FIG. 8. Number of cereal grains eaten per minute by wood-pigeons depending on grain density. Note that the scale on the abscissa and the actual graph are broken to save space. (From Murton 1968).
Any numerical responses shown by bird predators to changes in the density of their prey can most rapidly be achieved by emigration or immigration; more permanent changes dependent on reproduction must necessarily be slow and delayed, because birds have restricted breeding seasons. Figure 10, based on Mook (1963), shows how the numbers of bay-breasted warblers which settled to breed in certain Canadian conifer forests, after they had returned from migration, varied according to the density of the third instar larvae of the spruce budworm Choristoneura fumiferana. The response did not depend on the reproductive rate of the warblers: it resembles the behaviour of certain arctic birds of prey, like the snowy owl, which settle to breed in the Canadian arctic and in Scandinavia in those years when lemmings are abundant, and is similar to the behaviour of the short-eared owls already mentioned. There are, however, many cases in which a bird predator shows no numerical response to a specific prey component. An example is discussed below (see here) where it was found that numbers of wintering oystercatchers showed little variation over several seasons, although their preferred prey, second year cockles, fluctuated widely in numbers. This was because in seasons when second year cockles were scarce the birds fed on cockle spat and the older age groups, so that while oystercatcher numbers may have been related to the total cockle population they were not related to this one specific age group.
FIG. 9. Functional response of a predator to changes in prey density. The horizontal line C represents the total food of the predator equal to 100%. The proportion of a specific prey, either A or B, eaten by the predator is also shown, depending on changing density of A or B. Consider a predator eating B. At density 1 none is found and the predator’s diet is composed of 100% of C (this could be many different items considered in toto ). At density 3, 80% of the diet is composed of B and 20%, i.e. C—B, of other things again making a total of 100%C. (Based on Holling 1965).
The synthesis of the numerical and functional responses shown by a predator determines the nature of predation and its significance for the prey concerned, the main possibilities being represented in Fig. 11. Because bird predators must in most cases take time to respond to changes in prey density, any interaction must usually be delayed. The classical predator–prey relationship is shown at A in Fig. 11. Here the predator increases when prey is abundant, causing the prey to decrease. This results in a decrease of the predator, followed again by an increase of the prey. This ideal balance was first demonstrated in laboratory cultures of the protozoan Paramecium by Gause (1934), and was derived theoretically by Lotka (1925) and Volterra (1926). It is rare to find such perfect examples in wild populations, usually because predators have other prey which they turn to when their major source becomes scarce. An apparent case is shown in Fig. 12 which refers to the number of barn owls and kestrels ringed each year, and which may be taken as an index of their actual abundance. Snow (1968) has shown that most of the peaks of kestrels depend on high numbers being ringed in the north of England and south Scotland and they reflect fluctuations in the number of families ringed, not differences in the size of broods. There is no evidence for similar periodic fluctuations in southern England. Moreover, there is good evidence that the vole Microtus agrestis has been particularly abundant in the north of England in the same years that large numbers of kestrels have been found for ringing. But the curves seem to represent a numerical response of the predator, more kestrels settling to breed when vole numbers are high. There is no evidence that the survival rate of nestling or adult kestrels has varied in the different years in a way that would be expected in a classical predator–prey situation.
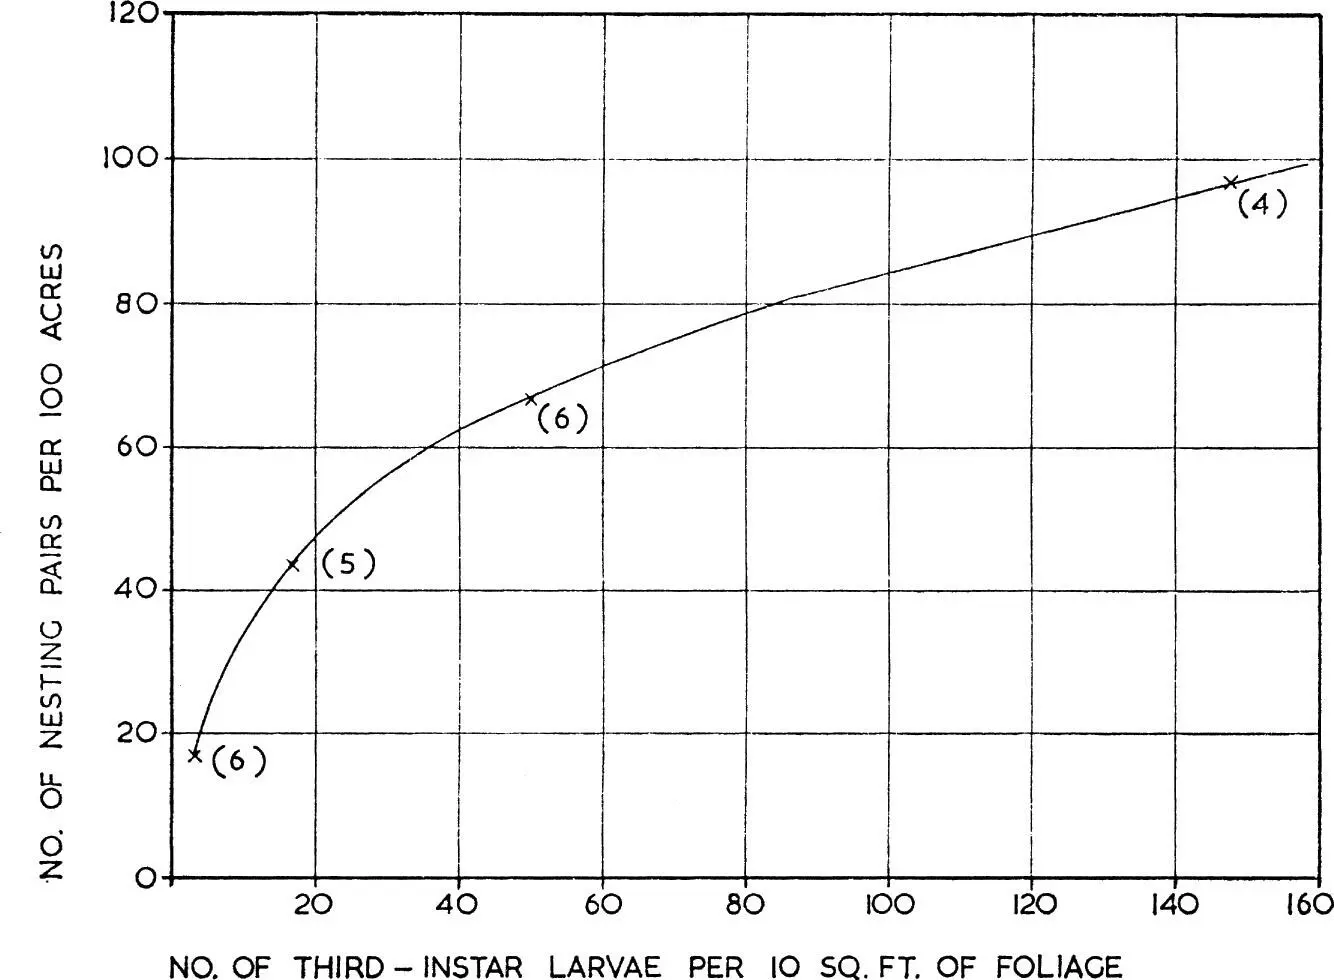
FIG. 10. Numerical response of predator to changes in prey density as shown by the number of nesting pairs of bay-breasted warblers per 100 acres of forest in relation to the number of third-instar larvae of the spruce budworm per 10 sq. ft. of foliage. (From Mook 1963).
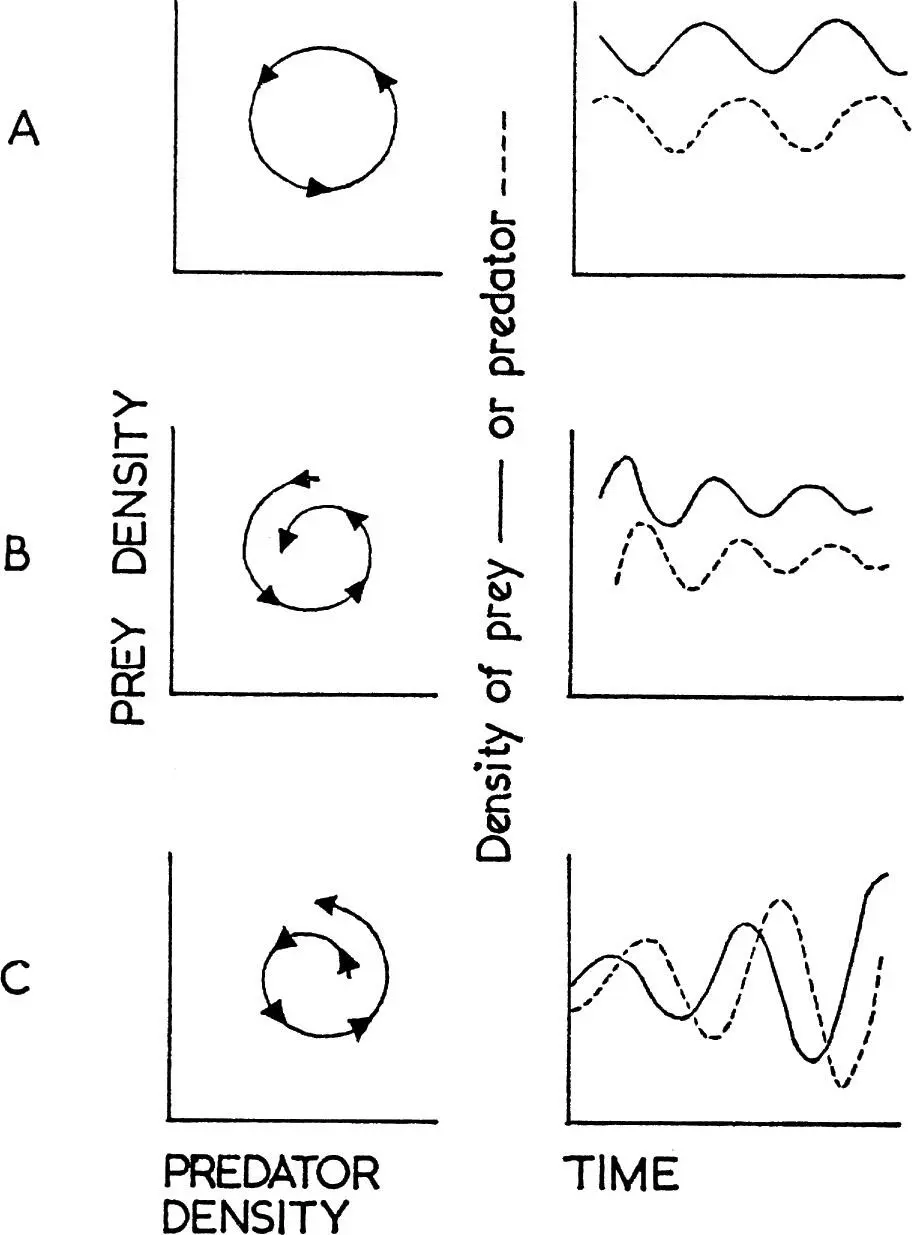
FIG. 11. Three possible interactions between a predator and its prey. On the left the numbers of predator are plotted against numbers of prey and successive points on the time scale chosen (months, years, etc.) joined in chronological order. In the right hand graphs the numbers of prey (solid line) or predator (dotted line) are plotted against time.
A. An increase in prey numbers if followed by an increase of predators which eat the prey, causing a decline in the prey which is followed by a decline in the predator so that with time a steady balance is maintained.
B. Predator density increases relative to prey density so that the regular oscillations shown at A become damped.
C. Prey density increases relative to predator numbers and the system become unstable with violent oscillations.
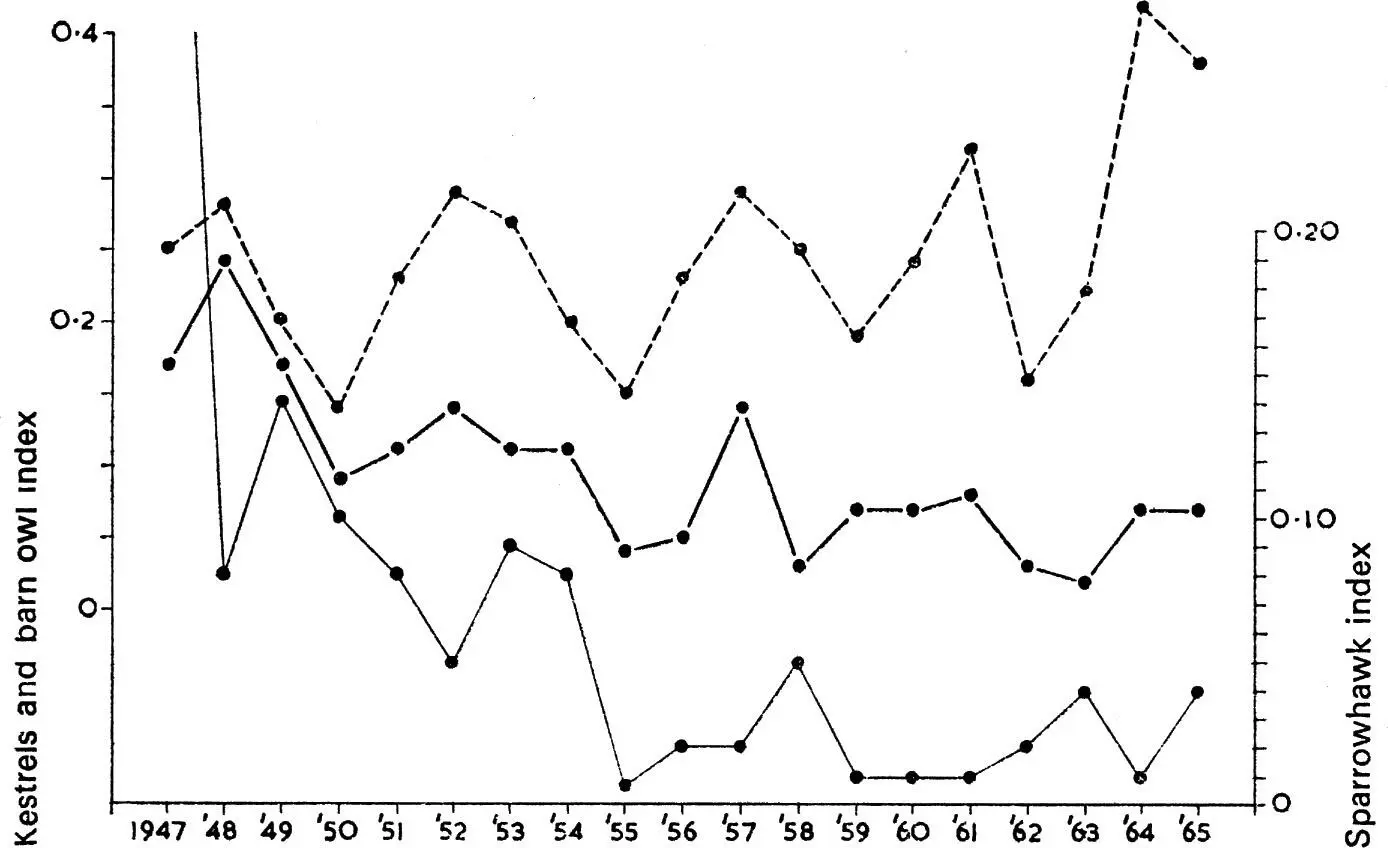
FIG. 12. Number of nestling kestrels (top) barn owls (middle) or sparrowhawks (bottom) ringed each year as a percentage of all nestlings ringed under the British Trust for Ornithology scheme. The ease with which observers find nestlings to ring is assumed to be an index of the populatuon at risk. The kestrel and barn owl feed on the same small rodent species and it is noticeable that their numbers fluctuate in parallel in a manner reminiscent of the classical predator–prey curve depicted in Fig.11a. In contrast, the sparrowhawk feeds on small birds (see Table 3) and its numbers do not fluctuate in the same way. The suggestion of a decline in sparrowhawk numbers is almost certainly a true indication of the changed status of the species due to contamination of its food supply with persistent organochlorine insecticides. The risks of such contamination are very much less for species feeding on small rodents.
Simple systems of this kind are theoretically liable to change to the kind shown at C in Fig. 11, where the oscillations between predator and prey become self-destructive and lead to the extinction of one or the other. Feeding patterns like those shown above density 3 in Fig. 9, where increased prey density is not compensated by an increased predation (in practice more animals would usually move in to take advantage of such good feeding conditions), tend to produce violent fluctuations. One reason that such oscillations rarely occur depends on the complexity of natural ecosystems as was discussed in the previous chapter (see here). Prey is effectively isolated in groups so that if one group is accidentally exterminated it is re-populated in a density-dependent way according to its own food supply; predators tend to be less efficient at very high prey densities; and some prey have refuges enabling them to escape predation. These factors plus the existence of more than one kind of predator all help to dampen the kind of expanding oscillation seen in Fig. 11c.
When the percentage of predation at first increases with rising prey numbers, there is a high probability that oscillations will be damped as in Fig. 11b. If the numbers of an insect increase, a proportional increase in the amount of predation by birds could bring the system back to its old level. There is good evidence from L. Tinbergen’s researches that this is what certain insectivorous birds may achieve in preying on forest insects in the manner shown in the sigmoid part of Fig. 9; fluctuations in prey density can be reduced and predator–prey oscillations damped, so reducing the risk of an infestation developing. But it is clear that if insect density rises beyond the level where the predation curve is S-shaped in Fig. 9, that is, if the prey achieves densities where a smaller proportion is taken with rising density, then the predator could not be held to have a regulating effect. As will be discussed in Chapter 4, birds cannot control an insect plague once it has developed, but they may help prevent it developing in the first instance. From the point of view of pest control or conservation one general lesson following from the above is that predator–prey interactions will be most stable in environments with a diverse structure supporting a wide variety of predators and prey, as for example, natural undisturbed oak woodland. Monocultures of introduced conifers would be expected to provide unstable conditions. Voute’s (1946) observation that outbreaks of insect pests are commoner in pure than in mixed stands of trees is, therefore, of considerable interest and adds weight to the suggestion that forestry policy should aim at intermixing deciduous trees in conifer woods (see here).
Читать дальшеИнтервал:
Закладка:
Похожие книги на «Collins New Naturalist Library»
Представляем Вашему вниманию похожие книги на «Collins New Naturalist Library» списком для выбора. Мы отобрали схожую по названию и смыслу литературу в надежде предоставить читателям больше вариантов отыскать новые, интересные, ещё непрочитанные произведения.


Обсуждение, отзывы о книге «Collins New Naturalist Library» и просто собственные мнения читателей. Оставьте ваши комментарии, напишите, что Вы думаете о произведении, его смысле или главных героях. Укажите что конкретно понравилось, а что нет, и почему Вы так считаете.