Trinath Sahoo - Root Cause Failure Analysis
Здесь есть возможность читать онлайн «Trinath Sahoo - Root Cause Failure Analysis» — ознакомительный отрывок электронной книги совершенно бесплатно, а после прочтения отрывка купить полную версию. В некоторых случаях можно слушать аудио, скачать через торрент в формате fb2 и присутствует краткое содержание. Жанр: unrecognised, на английском языке. Описание произведения, (предисловие) а так же отзывы посетителей доступны на портале библиотеки ЛибКат.
- Название:Root Cause Failure Analysis
- Автор:
- Жанр:
- Год:неизвестен
- ISBN:нет данных
- Рейтинг книги:5 / 5. Голосов: 1
-
Избранное:Добавить в избранное
- Отзывы:
-
Ваша оценка:
Root Cause Failure Analysis: краткое содержание, описание и аннотация
Предлагаем к чтению аннотацию, описание, краткое содержание или предисловие (зависит от того, что написал сам автор книги «Root Cause Failure Analysis»). Если вы не нашли необходимую информацию о книге — напишите в комментариях, мы постараемся отыскать её.
Provides the knowledge and failure analysis skills necessary for preventing and investigating process equipment failures Root Cause Failure Analysis: A Guide to Improve Plant Reliability
Root Cause Failure Analysis: A Guide to Improve Plant Reliability
Root Cause Failure Analysis — читать онлайн ознакомительный отрывок
Ниже представлен текст книги, разбитый по страницам. Система сохранения места последней прочитанной страницы, позволяет с удобством читать онлайн бесплатно книгу «Root Cause Failure Analysis», без необходимости каждый раз заново искать на чём Вы остановились. Поставьте закладку, и сможете в любой момент перейти на страницу, на которой закончили чтение.
Интервал:
Закладка:
Fault Tree Analysis
Fault tree analysis helps determine the root cause of failure of a system using Boolean logic to combine a series of lower level events. FTA is a deductive analysis depicting a visual path of failure. It is a top‐down analysis that helps determine the probability of occurrence for an undesirable event. The analysis creates a visual record showing the logical relationships between events and failures that lead to the undesirable event. It easily presents the results of your analysis and pinpoints weaknesses in the system.
The fault tree analysis (FTA) was first introduced by Bell Laboratories and is one of the most widely used methods in system reliability, maintainability and safety analysis. It is a deductive procedure used to determine the various combinations of hardware and software failures and human errors that could cause undesired events (referred to as top events) at the system level.
To do a comprehensive FTA, follow these steps:
1 Define the fault condition, and write down the top‐level failure.
2 Using technical information and professional judgments, determine the possible reasons for the failure to occur. Remember, these are level two elements because they fall just below the top‐level failure in the tree.
3 Continue to break down each element with additional gates to lower levels. Consider the relationships between the elements to help you decide whether to use an “and” or an “or” logic gate.
4 Finalize and review the complete diagram. The chain can only be terminated in a basic fault: human, hardware, or software.
5 If possible, evaluate the probability of occurrence for each of the lowest level elements and calculate the statistical probabilities from the bottom up.
Drawing Fault Trees: Gates and Events
Gate symbols represent results of interactions among contributing failure events and can vary among tools. Basic gates used to construct the Fault Tree can be seen below:
| Gate Symbol | Name | Causal Relation |
 |
OR | Output event occurs if any one of the input events occurs |
 |
AND | Output event occurs if all input events occur |
 |
BASIC | Basic event for which failure data is available. |
 |
INTERMEDIATE EVENT | System or component event description |
 |
TRANSFER | Indicates that this part of the fault tree is developed in a different part of the diagram or on a different page. |
FTA Gate Notes
Fault Tree probabilities can be computed by simple arithmetic only if basic events (component failures without lower level contributors) are independent. Independence is determined by ensuring the failure of one basic event has no effect on any other and groups of basic events cannot fail from common causes such as shock. For independent basic events with very small failure rates, typically found in electronic components, an AND gate output probability can be computed as the product of its input failure probabilities, and an OR gate output probability can be computed as the sum of its input failure probabilities.
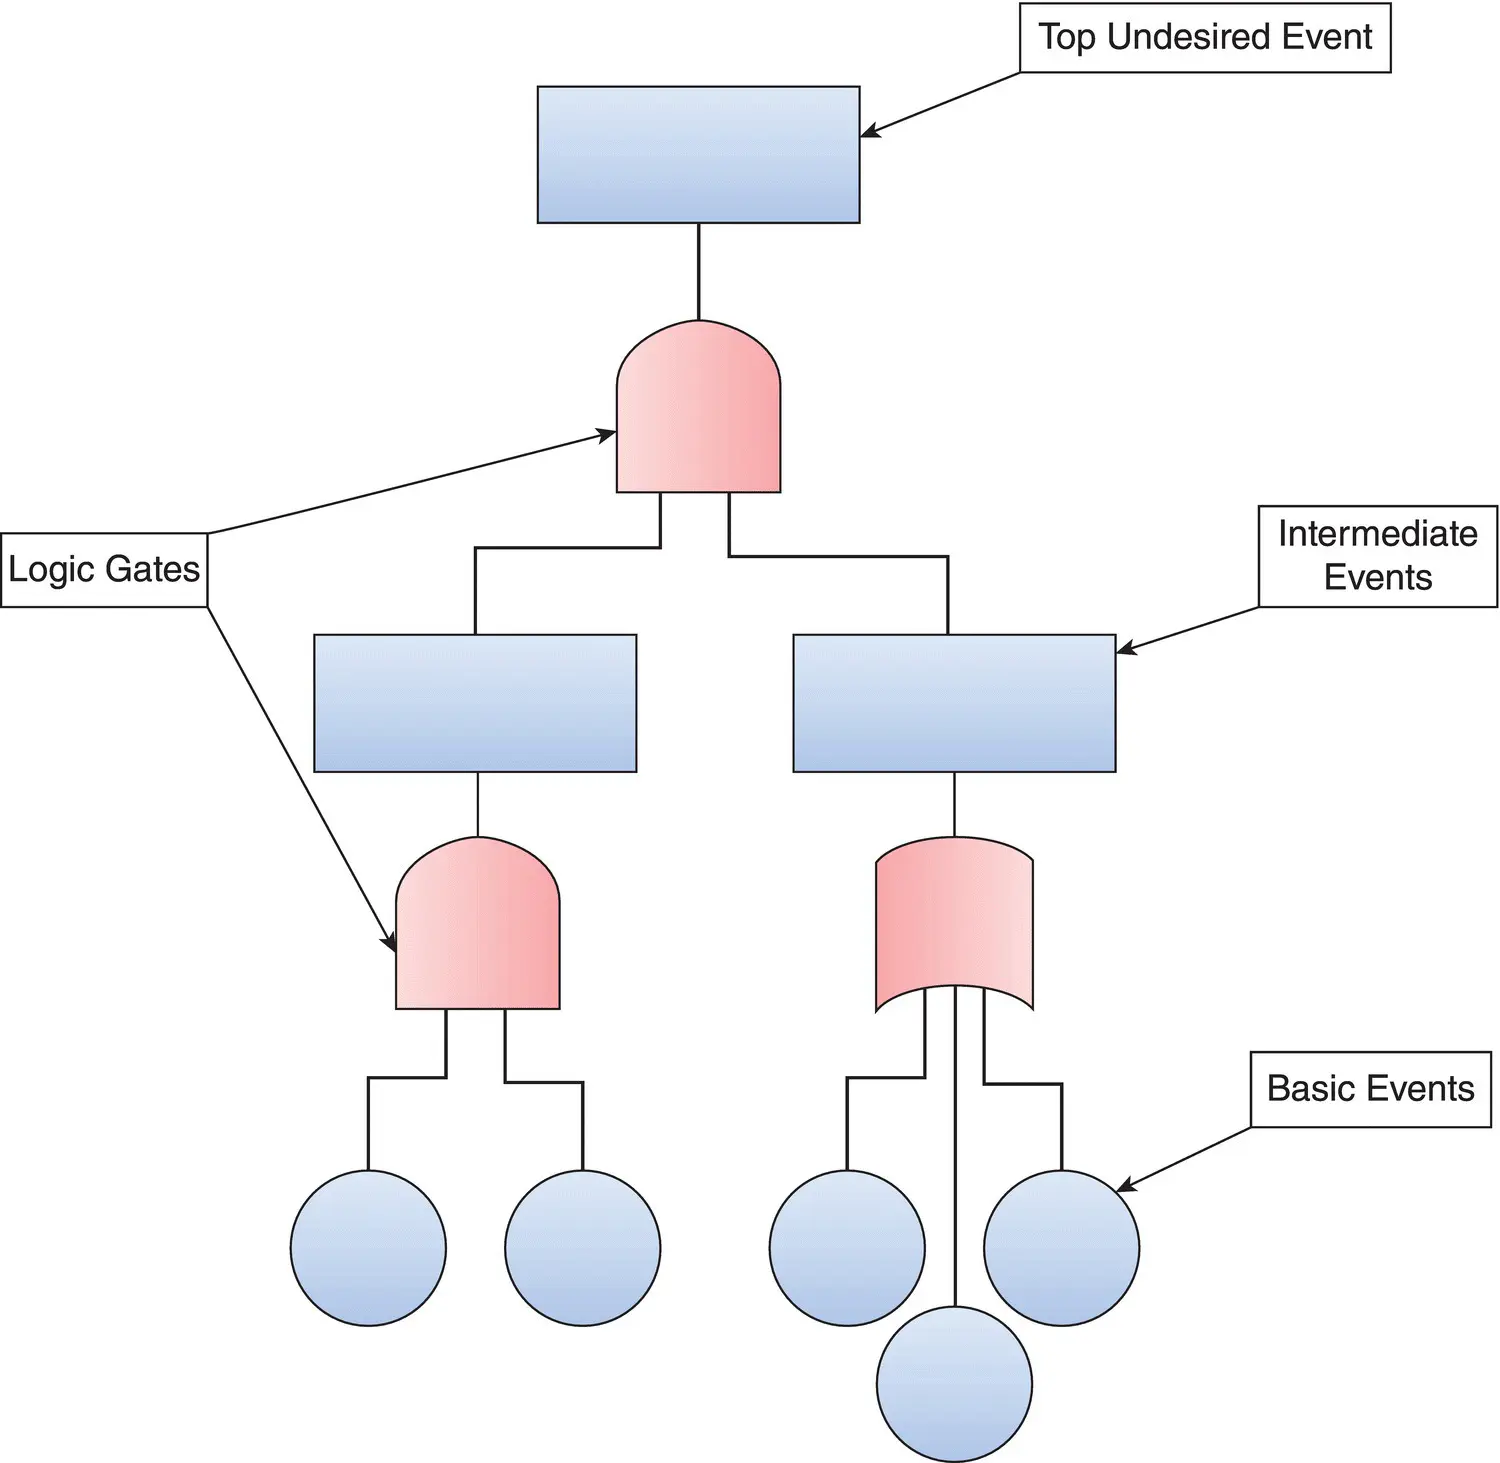
Below is a Basic Fault Tree Analysis Example Structure:
The five basic steps to perform a Fault Tree Analysis are as follows:
1 Identify the Hazard
2 Obtain Understanding of the System Being Analyzed
3 Create the Fault Tree
4 Identify the Cut Sets
5 Mitigate the Risk
Top‐level event is called a Cut Set. There are many cut sets within the FTA. Each has an individual probability assigned to it. The paths related to the highest severity / highest probability combinations are identified and will require mitigation.
How to Undertake a Fault Tree Analysis?
Although the nature of the undesired event may be quite different, fault tree analysis has the same procedure for any types of undesired event. To do a comprehensive fault tree analysis, simply follow the process below:
1 Define and identify the fault condition (hazard) as precisely as possible based on the aspects such as the amount, duration, and related impacts.
2 Using technical skills and existing facility details to list and decide all the possible reasons for the failure occurrence.
3 Break down the tree from the top level according to the relationship between different components until you work down to the potential root cause. The structure of your fault tree analysis diagram should be based on the top, middle (subsystems), and the bottom (basic events, component failures) levels.
4 If your analysis involves the quantitative part, evaluate the probability of occurrence for each of the components and calculate the statistical probabilities for the whole tree.
5 Double‐check your overall fault tree analysis diagram and implement modifications to the process if necessary.
6 Collect data, evaluate your results in full details by using risk management, qualitative, and quantitative analysis to improve your system.
Benefits of Fault Trees
A fault tree creates a visual record of a system that shows the logical relationships between events and causes that lead to failure. It helps others quickly understand the results of your analysis and pinpoint weaknesses in the design and identify errors. A fault tree diagram will help prioritize issues to fix that contribute to a failure. In many ways, the fault tree diagram creates the foundation for any further analysis and evaluation. For example, when changes or upgrades are made to the system, you already have a set of steps to evaluate for possible effects and changes. You can use a fault tree diagram to help design quality tests and maintenance procedures.
Identify the Root Cause
Look over your list of potential causal factors and determine the real reason this problem or issue occurred in the first place. These data should have provided enough insight into the failure for the investigator to develop a list of potential or probable reasons for the failure. Dig deep to examine each level of cause and effect and the events that led to the unfavorable outcomes. The problem is that in the real world it is never possible to prove a single event that solely initiates a whole chain of other events. That is because there are always other events before the so‐called “root cause event.” This may seem like semantics, but for problem‐solvers, it is important to keep in mind that there never is a silver‐bullet answer.
Читать дальшеИнтервал:
Закладка:
Похожие книги на «Root Cause Failure Analysis»
Представляем Вашему вниманию похожие книги на «Root Cause Failure Analysis» списком для выбора. Мы отобрали схожую по названию и смыслу литературу в надежде предоставить читателям больше вариантов отыскать новые, интересные, ещё непрочитанные произведения.


Обсуждение, отзывы о книге «Root Cause Failure Analysis» и просто собственные мнения читателей. Оставьте ваши комментарии, напишите, что Вы думаете о произведении, его смысле или главных героях. Укажите что конкретно понравилось, а что нет, и почему Вы так считаете.