Kirsten Birsak de Jersey - English in Inclusive Multilingual Preschools
Здесь есть возможность читать онлайн «Kirsten Birsak de Jersey - English in Inclusive Multilingual Preschools» — ознакомительный отрывок электронной книги совершенно бесплатно, а после прочтения отрывка купить полную версию. В некоторых случаях можно слушать аудио, скачать через торрент в формате fb2 и присутствует краткое содержание. Жанр: unrecognised, на английском языке. Описание произведения, (предисловие) а так же отзывы посетителей доступны на портале библиотеки ЛибКат.
- Название:English in Inclusive Multilingual Preschools
- Автор:
- Жанр:
- Год:неизвестен
- ISBN:нет данных
- Рейтинг книги:3 / 5. Голосов: 1
-
Избранное:Добавить в избранное
- Отзывы:
-
Ваша оценка:
English in Inclusive Multilingual Preschools: краткое содержание, описание и аннотация
Предлагаем к чтению аннотацию, описание, краткое содержание или предисловие (зависит от того, что написал сам автор книги «English in Inclusive Multilingual Preschools»). Если вы не нашли необходимую информацию о книге — напишите в комментариях, мы постараемся отыскать её.
English in Inclusive Multilingual Preschools — читать онлайн ознакомительный отрывок
Ниже представлен текст книги, разбитый по страницам. Система сохранения места последней прочитанной страницы, позволяет с удобством читать онлайн бесплатно книгу «English in Inclusive Multilingual Preschools», без необходимости каждый раз заново искать на чём Вы остановились. Поставьте закладку, и сможете в любой момент перейти на страницу, на которой закончили чтение.
Интервал:
Закладка:
The questionnaire consisted of close-ended questions with response options mainly of true-false items (that included the choices of yes, partly and no ) following the idea of the Likert scale (Dörnyei 2007, pp. 105-107). To understand participants’ reasons for their choices they were asked to write explanatory comments for each of their options so that they could be reconstructed and interpreted in the data analysis phase.
The response options of the true-false items will be evaluated quantitatively through the IBM SPSS Statistics programme: version 24 (2016). The data will be presented in the form of tables, graphs and pie diagrams. Participants’ reasons for their choices will be further analysed qualitatively by selecting representative key quotes from participants’ explanatory comments. On first inspection of teachers’ comments, it emerged that they often did not restrict their points of view to correspond with the focus of a particular question. For the data analysis this means that I will select comments that are relevant to the focus of each question rather than limiting myself to relate a comment only to the question that intended to prompt it. Therefore, the questions that correspond to the key quotes are noted in code form in brackets at the end of the quotes to be able to retrace the source that triggered the data in a valid way (for example: qu. 4c-1 or final comment). Chosen options that are connected to the comments are included in the coding (for example : qu. 3b-1: yes).
As the questionnaire distinguished between preschool teachers’ attitudes towards introducing English as seen from the perspectives of the children (→ question 3) and as seen from the perspectives of the preschool teachers (→ question 4) validity of findings is supported through the strategy of ‘within-method triangulation’ in the questionnaire, which allows to identify convergence of the two perspectives (Altrichter & Posch, 2007, pp. 178-179; see also Denzin, 1978 & Flick, 2004).
The questionnaire was written in German; the questions have been translated in English for this publication. The preschool teachers’ comments were handwritten and directly taken from the questionnaires for the analysis purpose. The transcription follows the guidelines of a simple transcription system (cf. Dresing et al., 2015, pp. 27-28). The transcription is literal and only language mistakes are corrected. Words and phrases that contained features of the Austrian German vernacular are transcribed in German to support understanding of the data.
Results of the questionnaire survey are presented in the next chapters following the purposes of the questionnaire as has been outlined in the introduction to this chapter. The analysis of data will be used to draw consequences for the set-up of the teacher education project to provide support for participating preschool teachers so that their needs are able to be addressed appropriately.
3.2 Survey of state preschool teachers’ contexts of work
The identification of a preschool that would qualify to represent the working conditions of the general educational state preschool context in the Salzburg area would require an analysis that ideally involved all the state preschools in this education context. Questions therefore first aimed to identify the preschool’s size which included the number of groups in a preschool and the group size (→ question 1a, 1b) and the number of children who spoke German as a second or third language (→ question 1c). This would indicate how many preschools were multilingual in profile. The next question aimed to find out if preschools provided support for the children to learn German and who was responsible to teach it (→ question 2a). This would provide an insight both in the workload of the staff and in their experience in the area of language teaching. Finally, the contextual framework also included the question of how many preschools actually offered English, and if they did offer English, whether the preschool teachers themselves taught English or if it were taught by external staff. It also aimed to find out if English was an integral part of an individual preschool’s programme and in what way it was organised (→ question 2b).
Results are presented in the following chapters.
3.2.1 The size and characteristics of children’s groups
State preschools vary from area to area. Some of the preschools are small with only one or two groups while others have up to five or six groups, depending on whether they are situated in a densely populated area or not. The size of the groups also varies. There is also a quite substantial diversity when it comes to children’s language profiles. While in some preschools almost all the children learn German as a second or third language, other preschools only have a few children with a multilingual background in their groups. Despite this heterogeneity of state preschool contexts, it would be necessary to identify a type of preschool that would qualify to be representative for the majority of preschools in this context as only then a suitable sample for the teacher education research could be identified. Data that provided this information resulted from the following questions:
How many groups are in your preschool? (Wie viele Gruppen gibt es in Ihrem Kindergarten?) (question 1a).
How many children are in your group? (Wie viele Kinder sind in Ihrer Gruppe?) (question 1b).
How many children speak German as their second or third language? (Für wie viele Kinder ist Deutsch die zweite oder dritte Sprache?) (question 1c).
In statistical data 1 (below) the horizontal bar shows the number of groups that made up the sizes of the preschools, while the vertical frequency bar represents the number of preschools that had those numbers of groups (e.g., 13 preschools consist of 2 groups). Statistical data 2 (below) represents the number of children in 89 groups out of 127 groups, which took part in the survey. The horizontal bar illustrates the number of children in the preschool groups and the vertical frequency bar represents the number of groups that comprised those children (e.g., 10 of the preschool groups from the state preschools included 20 children).
From all of the 30 preschools that participated in the survey the majority of the preschools (27 preschools) comprised between two groups and four groups (→ statistical data 1) and of the 89 groups that responded to question 1b, the majority of the group sizes ranged between 19 children and 25 children (→ statistical data 2). There were only few exceptions: in terms of the size of the preschool, the smallest state preschool provided only one group while the two largest state preschools offered 6 and 5 groups respectively. In terms of the size of the groups, there were 9 preschools with small groups (13 to 19 children in a group). Reduced sizes of groups are usually due to the special needs of some of the children in the group. The largest groups comprised 25 children, which was the case in 24 groups (→ statistical data 2).
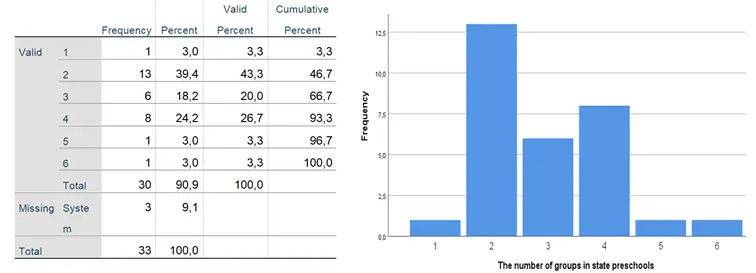 Figure 2:
Statistical data 1: The number of groups in state preschools
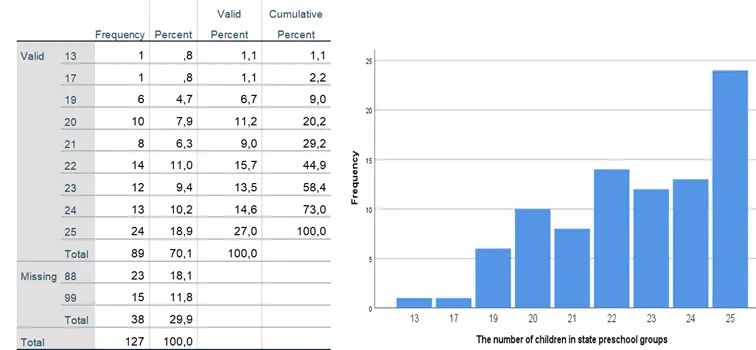 Figure 3:
Statistical data 2: The number of children in state preschool groups
The following statistical data 3 illustrates the number of children who were learning German in state preschool groups at the time of the research (horizontal bar). The vertical frequency bar relates the number of children who were learning German to the number of preschool groups comprising of those numbers, thereby showing the frequency of the numbers of the children in the groups (e.g., in 8 groups there were 13 children who were learning German as a second language).
Читать дальшеИнтервал:
Закладка:
Похожие книги на «English in Inclusive Multilingual Preschools»
Представляем Вашему вниманию похожие книги на «English in Inclusive Multilingual Preschools» списком для выбора. Мы отобрали схожую по названию и смыслу литературу в надежде предоставить читателям больше вариантов отыскать новые, интересные, ещё непрочитанные произведения.


Обсуждение, отзывы о книге «English in Inclusive Multilingual Preschools» и просто собственные мнения читателей. Оставьте ваши комментарии, напишите, что Вы думаете о произведении, его смысле или главных героях. Укажите что конкретно понравилось, а что нет, и почему Вы так считаете.