This stage is right if:
The democratization of data would help others explore and understand data without help.
It's time to teach and enable business users to be more effective.
Projects exist that require different formats than what currently exists in the data lake.
Having truly informed employees is vital to your company's competitive success.
It's time for the next stage if:
The data mart stage is the final stage. There can be any number of marts, and there can be multiple levels of marts if needed. After implementing this stage, data arrives in a complete, well‐architected, and governed stack that continually evolves to support an informed and competitive company.
STAGE 1 SOURCE aka Siloed Data
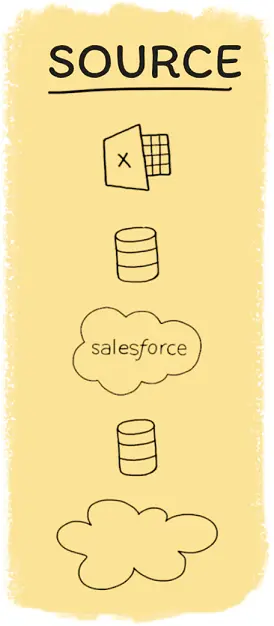
Modern businesses, even modest sized ones, generate heaps of data that comes in several flavors—product information, customer information, app performance, marketing expenditures, and more. A new business can work with data from production databases, product APIs, and financials directly from their sources.
Over time, as sources accumulate more data, the number of data channels grows as well. It becomes even more challenging to manage data across separate sources.
This section is about helping you work with sources. We talk about what sources are and what we can do with them. From there, we survey the tools commonly used to connect and investigate sources; for each example, we offer quick but tested thoughts on how these tools can be used by your team. We complete our discussion on sources by encouraging best practices on how to work with data during the source stage. We advocate for source replicas and streamlined data intelligence tools.
This stage is ideal for new companies or teams with minimal data needs. It is inexpensive and relatively easy to tool, implement, and maintain. While it is exciting to build out a sophisticated data stack, it is not necessary before circumstances require it. Over-engineering is a costly mistake. However, the methods discussed in Chapters 1, 2, and 3set the stage for your future data lake and data warehouse that arise as the scale and diversity of your source data proliferate.
Chapter One Starting with Source Data
When starting from scratch, keep in mind the potential for the data to grow and the usability needs of users in the future. In the beginning, sources are their own islands separated from each other. Data streams remain in their own “silo.” When a data team is small, a collection of sources is easy to maintain and monitor. For example, to support new data teams, many data sources have their own built‐in dashboards and reporting capabilities (see Salesforce, Heap, and so on).
While single‐source data isn't all that powerful, it's not at all useless. Some everyday use cases of solutions built from single‐source data include:
Database queries that generate customer acquisition metrics.
A dashboard that displays monthly sales featuring a downloadable spreadsheet.
A custom web application that allows searching of referral traffic.
Siloed reporting does not yield the powerful data insights that more sophisticated teams need, but this is often where teams must start. The analyst's role becomes that of an instructor to stakeholders—the analyst must understand sources and support business stakeholders who read and interact with this limited data. An analyst may pull together numbers from separate comma‐separated value files (CSVs) and run manual analysis in Excel or with basic SQL queries.
As we explore data sources, remember that analysts can do much more for their teams than work with business intelligence tools, Excel, and simple queries. In time, they can build abstractions on top of the data that make data accessible to other colleagues and self‐servable (more on this in Stages 2 and 3).
Common Options for Analyzing Source Data
Data ends up in many different places, but the methods to analyze them boil down to application dashboards, Excel spreadsheets, SQL IDEs, cloud dashboarding tools, or business intelligence (BI). We proceed to touch on several common tools used for interacting with sources, giving a short judgment on when and how to use them ( Figure 1.1).
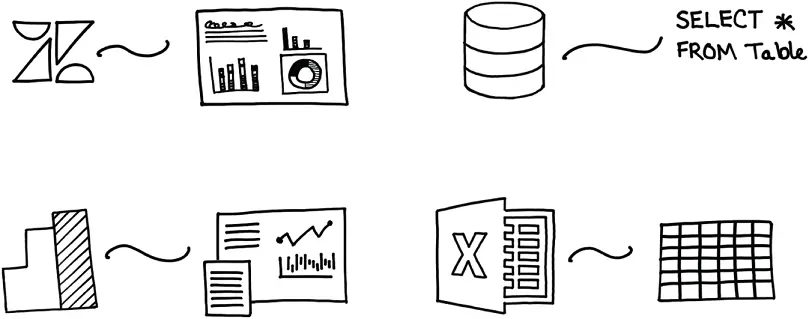
Figure 1.1Various methods for data analysis for data sources.
Get to Know Data with Application Dashboards
Many modern software as a service (SaaS) applications come built with a set of fixed dashboards and visualizations to showcase the data they are capturing ( Figure 1.2). These charts are highly tuned to specific use cases and can be quite informative—and maybe meet all data needs. Some, like Salesforce, even have a customizable chart and dashboard creator built in to support ad‐hoc querying. Many have custom query languages, too. These can go a long way, especially when there is no need to see this data in combination with other data. An additional part of the value proposition underlying these tools is vendor support staff, who help answer questions or fulfill special data needs.
One word of caution: keep an eye out for how often single sources of data need combining with other sources. Perhaps you often fulfill queries like “tell me what lead type creates the most customer support tickets,” that is, business asks that require analysis across multiple sources. If your team finds themselves playing the part of “glue” between single sources all too often, it may be time to move to the Data Lake stage.
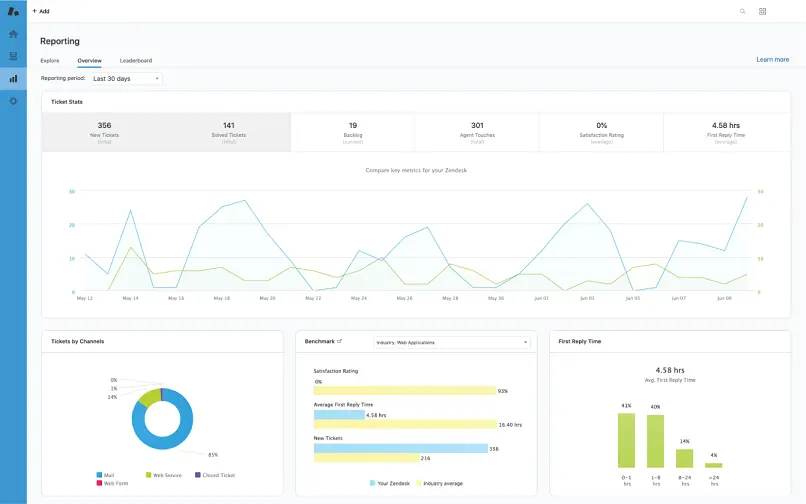
Figure 1.2Example built in dashboard showing common metrics from Zendesk.
Source: “Zendesk ”
Ask Interesting Questions with Excel
Most applications can export some of their data into CSV formatted files ( Figure 1.3). Anyone with Excel or Google sheets can then import that data and analyze it. While this is an effective way to expand the questions that one can ask of data from applications, it is relatively manual and requires frequent updates to keep data current.
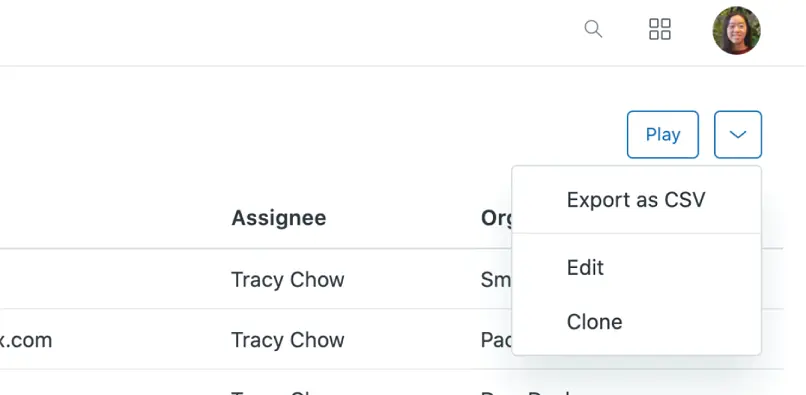
Figure 1.3A basic export feature on a web services dashboard providing a CSV download.
Source: Microsoft
Query Databases with an SQLIDE
For data sources such as a production database, they can be queried directly from the command line, but this can get messy and hard to keep track of queries and results. We suggest setting up an integrated development environment (IDE) such as pgAdmin to better handle querying data within a schema ( Figure 1.4). These tools have features that support writing queries (i.e. autocomplete), saving queries, and exporting data.
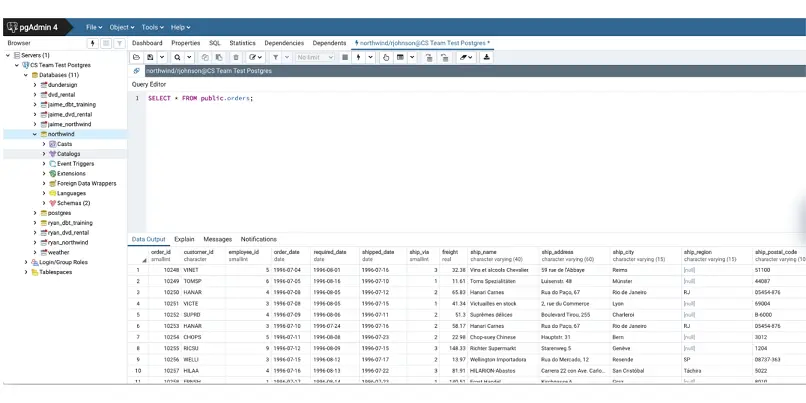
Figure 1.4pgAdmin dashboard is a popular IDE for PostgreSQL.
Читать дальше
