EIB Investment Survey 2021 - European Union overview
Здесь есть возможность читать онлайн «EIB Investment Survey 2021 - European Union overview» — ознакомительный отрывок электронной книги совершенно бесплатно, а после прочтения отрывка купить полную версию. В некоторых случаях можно слушать аудио, скачать через торрент в формате fb2 и присутствует краткое содержание. Жанр: unrecognised, на английском языке. Описание произведения, (предисловие) а так же отзывы посетителей доступны на портале библиотеки ЛибКат.
- Название:EIB Investment Survey 2021 - European Union overview
- Автор:
- Жанр:
- Год:неизвестен
- ISBN:нет данных
- Рейтинг книги:5 / 5. Голосов: 1
-
Избранное:Добавить в избранное
- Отзывы:
-
Ваша оценка:
EIB Investment Survey 2021 - European Union overview: краткое содержание, описание и аннотация
Предлагаем к чтению аннотацию, описание, краткое содержание или предисловие (зависит от того, что написал сам автор книги «EIB Investment Survey 2021 - European Union overview»). Если вы не нашли необходимую информацию о книге — напишите в комментариях, мы постараемся отыскать её.
EIB Investment Survey 2021 - European Union overview — читать онлайн ознакомительный отрывок
Ниже представлен текст книги, разбитый по страницам. Система сохранения места последней прочитанной страницы, позволяет с удобством читать онлайн бесплатно книгу «EIB Investment Survey 2021 - European Union overview», без необходимости каждый раз заново искать на чём Вы остановились. Поставьте закладку, и сможете в любой момент перейти на страницу, на которой закончили чтение.
Интервал:
Закладка:
INVESTMENT DYNAMICS BY COUNTRY
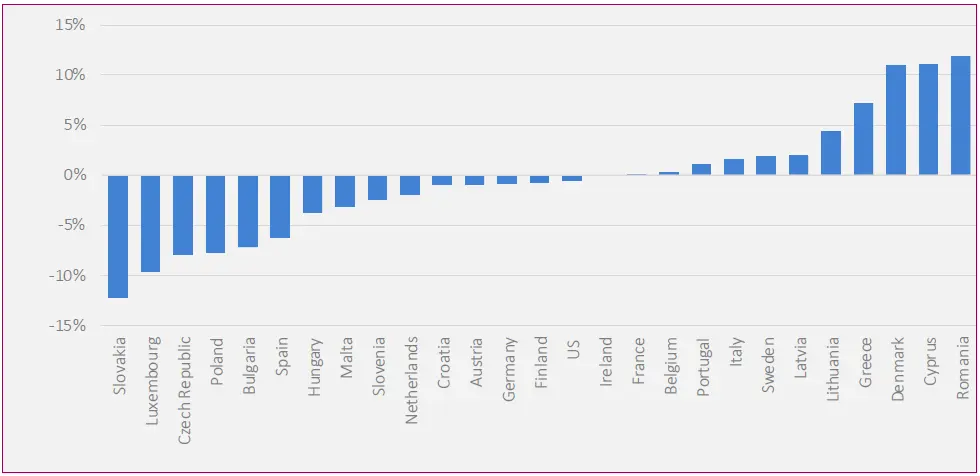
Total gross fixed capital formation (in real terms) in 2021 Q2 relative to 2019 Q4 (data from 2021 Q1 for Bulgaria, Czech Republic, Luxembourg and Romania).
Source: Eurostat for EU data, Central Statistics Office (CSO) for Ireland, Bureau of Economic Analysis for US data.
The growth rates relative to 2019 Q4 have been calculated using a moving sum of each quarter and the three previous quarters to correct for the lack of seasonal adjustment in the data.
Investment in Estonia increased by 40% in 2021 Q2 with respect to 2019 Q4, due almost entirely to a one-off jump in IPP investment during the period. Due to the lack of a corrected series, we do not report it in the chart.
Investment dynamics and focus
INVESTMENT CYCLE AND EVOLUTION OF INVESTMENT EXPECTATIONS
Firms operating in the EU hold a positive outlook towards their future investment, bouncing back from low investment levels in 2020. In fact, a much larger share of firms — particularly large firms and those in the manufacturing sector — expect to increase rather than decrease their investment in 2021. This represents a substantial positive shift from EIBIS 2020, as investment expectations have bounced back to pre-EIBIS 2020 levels. The United States maintains a more positive investment outlook than the European Union. Within the European Union, with the exception of Malta, all EU countries hold a positive investment outlook.
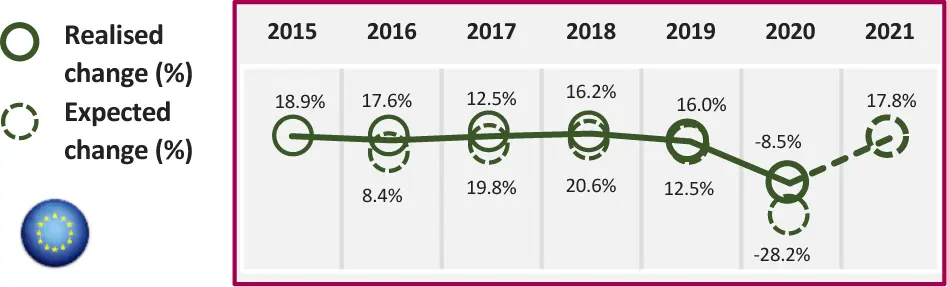
‘Realised change’ is the share of firms who invested more minus those who invested less; ‘Expected change’ is the share of firms who expect(ed) to invest more minus those who expect(ed) to invest less.
Base: All firms
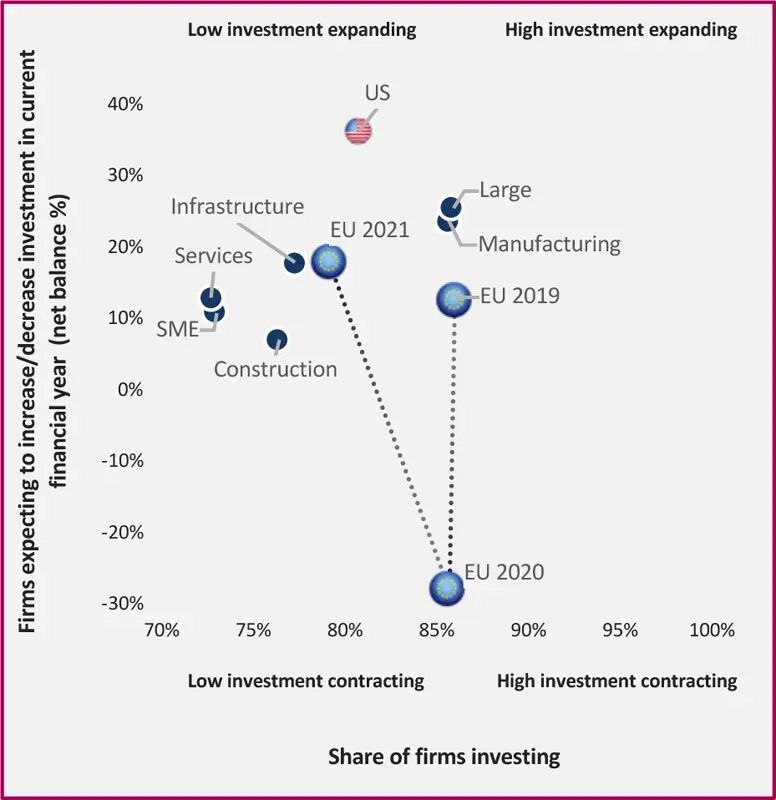
Share of firms investing shows the percentage of firms with investment per employee greater than EUR 500.
Base: All firms (excluding don’t know/refused responses)
INVESTMENT CYCLE AND EVOLUTION OF INVESTMENT EXPECTATIONS BY COUNTRY
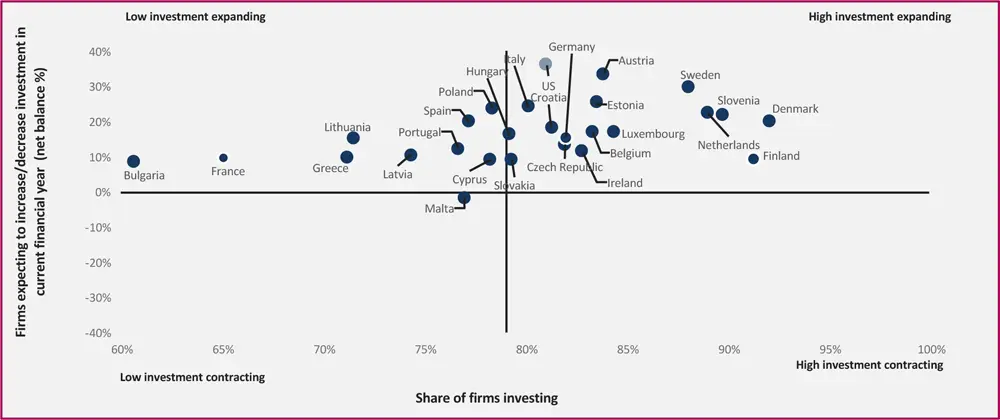
Share of firms investing shows the percentage of firms with investment per employee greater than EUR 500. The y-axis line crosses the x-axis on the EU average for 2020.
Base: All firms (excluding don’t know/refused responses)
PURPOSE OF INVESTMENT IN LAST FINANCIAL YEAR(% of firms’ investment)
On average, firms across the European Union spent half of their investment on replacement in 2020, in line with EIBIS 2020 — ranging from 46% in the manufacturing sector to 57% in the construction sector. Investment in capacity expansion also accounted for a large proportion of total investment spent (25%). Investment in new products and services accounted for a lower share of the total expenditure (17%), particularly in the construction sector (9%).
The proportion of investment allocated to capacity expansion was highest in Latvia (38%) and lowest in Cyprus (13%); allocation for replacement was highest in France (61%) and lowest in Ireland (30%); and the share allocated to new products or services was highest in Ireland (29%) and lowest in Croatia (10%).
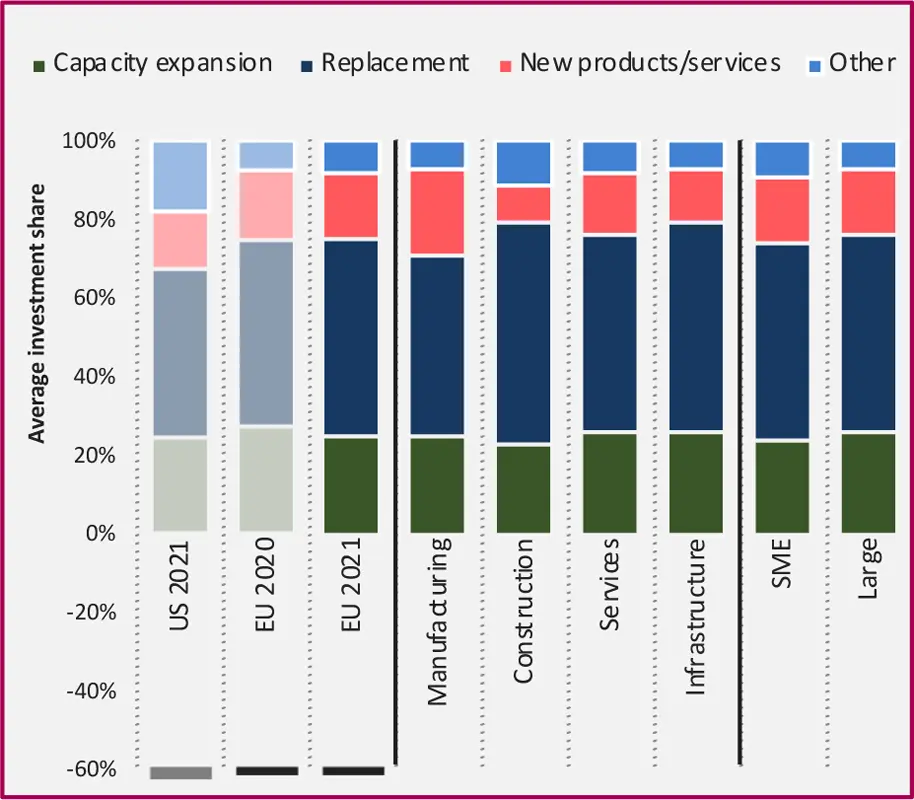
Q. What proportion of total investment was for (a) replacing capacity (including existing buildings, machinery, equipment, IT) (b) expanding capacity for existing products/services (c) developing or introducing new products, processes, services?
Base: All firms who have invested in the last financial year (excluding don’t know/ refused responses)
PURPOSE OF INVESTMENT IN LAST FINANCIAL YEAR BY COUNTRY(% of firms’ investment)
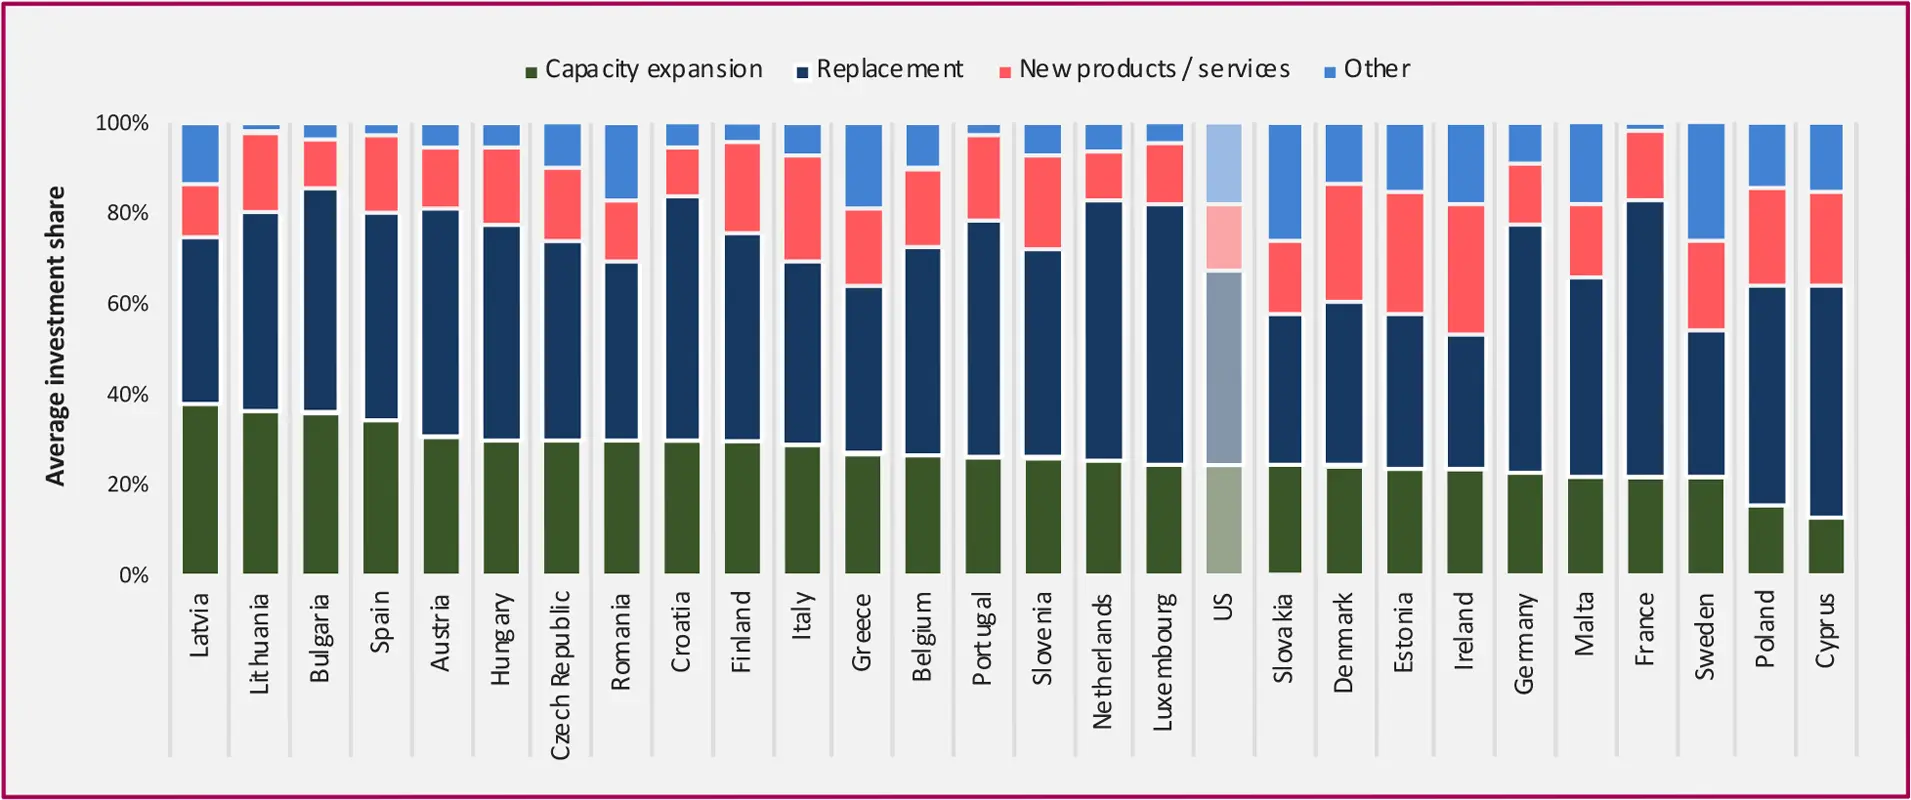
Q. What proportion of total investment was for (a) replacing capacity (including existing buildings, machinery, equipment, IT) (b) expanding capacity for existing products/services (c) developing or introducing new products, processes, services?
Base: All firms who have invested in the last financial year (excluding don’t know/ refused responses)
Investment focus
INVESTMENT AREAS
Investment in intangible assets (R&D, software, training and business processes) by European firms increased slightly in 2020 compared to what was reported in EIBIS 2020 for 2019.
Investment activities varied depending on the sector and size of the business. Small and medium companies (SMEs) and firms in the services sector invested a higher share in intangible assets and a lower share in tangible assets (land, buildings, infrastructure and machinery).
Firms in Croatia, Bulgaria, Hungary and Poland invested the lowest share in intangible assets. The share of intangibles assets was highest in Ireland and Cyprus.
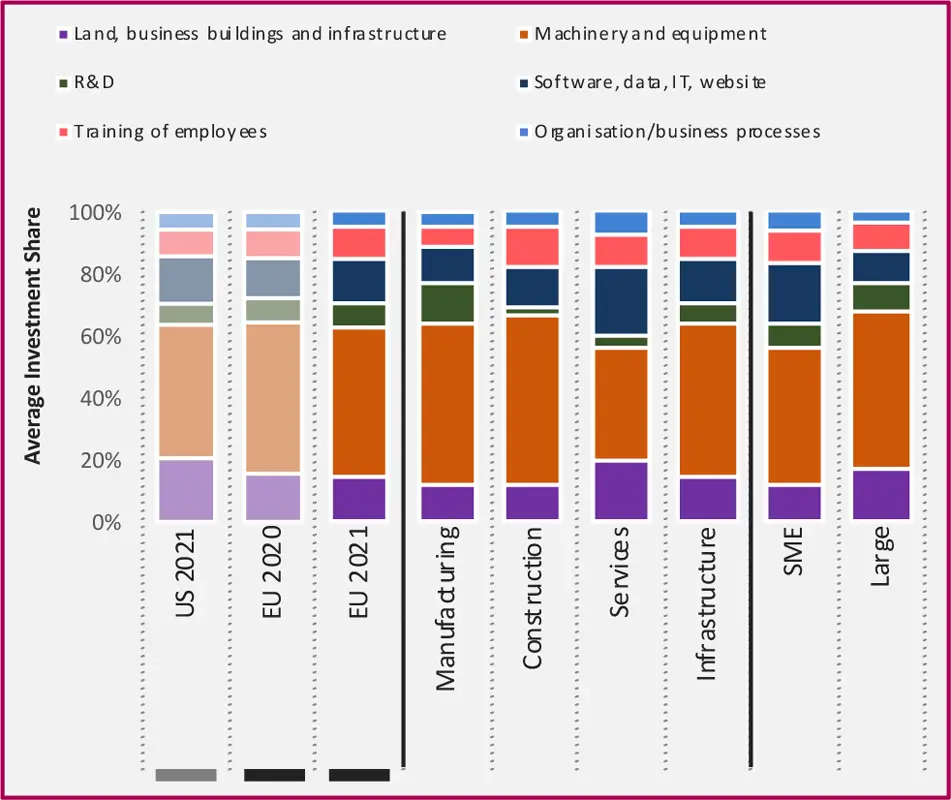
Q. In the last financial year, how much did your business invest in each of the following with the intention of maintaining or increasing your company’s future earnings?
Base: All firms who have invested in the last financial year (excluding don’t know/ refused responses)
INVESTMENT AREAS BY COUNTRY
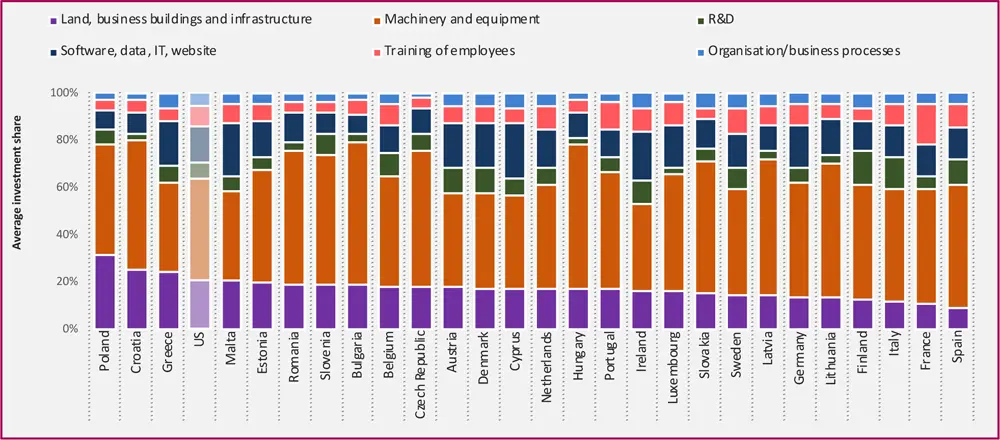
Q. In the last financial year, how much did your business invest in each of the following with the intention of maintaining or increasing your company’s future earnings?
Base: All firms who have invested in the last financial year (excluding don’t know/ refused responses)
Конец ознакомительного фрагмента.
Текст предоставлен ООО «ЛитРес».
Прочитайте эту книгу целиком, купив полную легальную версию на ЛитРес.
Безопасно оплатить книгу можно банковской картой Visa, MasterCard, Maestro, со счета мобильного телефона, с платежного терминала, в салоне МТС или Связной, через PayPal, WebMoney, Яндекс.Деньги, QIWI Кошелек, бонусными картами или другим удобным Вам способом.
Интервал:
Закладка:
Похожие книги на «EIB Investment Survey 2021 - European Union overview»
Представляем Вашему вниманию похожие книги на «EIB Investment Survey 2021 - European Union overview» списком для выбора. Мы отобрали схожую по названию и смыслу литературу в надежде предоставить читателям больше вариантов отыскать новые, интересные, ещё непрочитанные произведения.


Обсуждение, отзывы о книге «EIB Investment Survey 2021 - European Union overview» и просто собственные мнения читателей. Оставьте ваши комментарии, напишите, что Вы думаете о произведении, его смысле или главных героях. Укажите что конкретно понравилось, а что нет, и почему Вы так считаете.