The Wiley-Blackwell Handbook of Childhood Social Development
Здесь есть возможность читать онлайн «The Wiley-Blackwell Handbook of Childhood Social Development» — ознакомительный отрывок электронной книги совершенно бесплатно, а после прочтения отрывка купить полную версию. В некоторых случаях можно слушать аудио, скачать через торрент в формате fb2 и присутствует краткое содержание. Жанр: unrecognised, на английском языке. Описание произведения, (предисловие) а так же отзывы посетителей доступны на портале библиотеки ЛибКат.
- Название:The Wiley-Blackwell Handbook of Childhood Social Development
- Автор:
- Жанр:
- Год:неизвестен
- ISBN:нет данных
- Рейтинг книги:5 / 5. Голосов: 1
-
Избранное:Добавить в избранное
- Отзывы:
-
Ваша оценка:
The Wiley-Blackwell Handbook of Childhood Social Development: краткое содержание, описание и аннотация
Предлагаем к чтению аннотацию, описание, краткое содержание или предисловие (зависит от того, что написал сам автор книги «The Wiley-Blackwell Handbook of Childhood Social Development»). Если вы не нашли необходимую информацию о книге — напишите в комментариях, мы постараемся отыскать её.
The Wiley-Blackwell Handbook of Childhood Social Development The latest edition offers brand-new chapters on helping children with autism, the impact of social networking platforms on childhood social development, the influence of mass media, war and famine, the climate crisis, and the influence of the COVID-19 Pandemic.
Containing authoritative explorations of child social development from pre-school to the onset of adolescence,
also provides:
A thorough introduction to historical perspectives on the social development of children, including the conceptual and empirical precursors of contemporary social development research Comprehensive explorations of various disciplinary perspectives, including behavioral genetics, the brain and social development in childhood, and evolutionary perspectives on social development Practical discussions of the ecological contexts of childhood social development, including the relationship between the physical environment and social development In-depth examinations of culture and immigration, including the social development of immigrant children with a focus on Europe, and on Asian and Latinx children in the US. Perfect for advanced undergraduate and graduate students of courses in child psychology, human development, or educational psychology,
will also earn a place in the libraries of researchers seeking a one-stop, comprehensive resource for the social development of children.
The Wiley-Blackwell Handbook of Childhood Social Development — читать онлайн ознакомительный отрывок
Ниже представлен текст книги, разбитый по страницам. Система сохранения места последней прочитанной страницы, позволяет с удобством читать онлайн бесплатно книгу «The Wiley-Blackwell Handbook of Childhood Social Development», без необходимости каждый раз заново искать на чём Вы остановились. Поставьте закладку, и сможете в любой момент перейти на страницу, на которой закончили чтение.
Интервал:
Закладка:
MR technologies do not expose the child to radiation, but there were a host of technical issues that had to be overcome, especially for quantitative analyses of the brain (see Bigler, 2017). Courchesne et al. (2000) and Pfefferbaum et al. (1994), both demonstrated how developmental brain changes could be analyzed in healthy individuals using MRI. The MR image, as shown in Figure 3.2, is actually derived from detecting a radiofrequency (RF) signal sensitive to the movement of water molecules, which differs between GM, where neuronal cell bodies and synapses are located, WM, where myelinated axons are located, and cerebrospinal fluid (CSF) spaces within the brain. Taking advantage of WM, GM, and CSF signal intensity differences permits the direct calculation of various ROIs in terms of area, volume, thickness, and other metrics (Bigler, 2017).
Using this quantitative approach with MRI scans, both Courchesne et al. (2000) and Pfefferbaum et al. (1994) calculated total intracranial volume (TICV) and plotted that along with total brain volume (TBV), WM and GM volume. Growth curves of both TICV and TBV mirror one another, with correlations that exceed 0.90 (see Bigler, 2021) through ~ 5 years of age, the HC, TICV, and TBV measures remain highly intercorrelated.
As shown in Figure 3.1, within GM, once a peak is reached there is a period of apoptosis (cell death) and cellular pruning. Theoretically, the initial excess of neural cells reflects a buffer against potential traumatic birth injury as well as dealing with inherent subtle errors making some cells expendable (Towbin, 1978). As cells compete for functional connectivity but do not become established or have an error in synaptic function, biologically these cells may not be essential. This competition from inclusion/exclusion in the neural developmental matrix that forms the brain, has been viewed as a type of a Darwinian competition for neural cell survival (Szilagyi et al., 2016). The apoptosis may come about because of critical periods where either input or output connections fail to sufficiently occur and the cell dies or is “pruned” back (Moreno et al., 2015).
As shown in Figure 3.3, while the neuronal count that makes up GM stabilizes, the robust changes in WM (i.e., myelination) continue to dominate brain development. This in no way diminishes what occurs in GM, because that is where synaptogenesis, dendritic arborization changes associated with learning and neural transmission occurs, but myelination does emphasize neural connectivity and speed of neural transmission. Therefore, developmentally, synaptic transmission rates depend on the healthiest rates of myelination and their association with critical GM regions. Graphically, displayed in Figure 3.4shows the progression of the WM signal intensity reflecting rapid increases of WM myelination in MRI studies done from birth through 3 years of age.
The side view (sagittal) MRI taken at different stages of infant development, as shown in Figure 3.4, also aligns with standardized infant development scales designed to assess early motor, sensory, and language development of the individual infant compared to a normative sample. At this early stage of development, the degree of myelination highly correlates with basic motor, sensory, and language acquisition. Of course, being able to move about and interact as well as sense the environment along with communication are the foundational abilities for social interaction. Plotting the changes of this MRI‐derived myelination coefficient shows how motor and somatosensory regions (see upper panels) of the posterior frontal lobe and anterior parietal, respectively come online as the first to show increased myelination after birth, followed by the superior temporal gyrus (lower panels), which houses auditory cortex. These areas of increased myelination map distinctly to the primary motor, somatosensory, and auditory processing networks in the developing brain. What emerge next are the connective WM tracts from auditory cortex in the temporal lobe with motor control centers in the frontal lobe for speech production. Not shown in this particular sagittal plane is visual cortex and the optic tracts, which also develop rapidly supporting the visual sensory system as well.
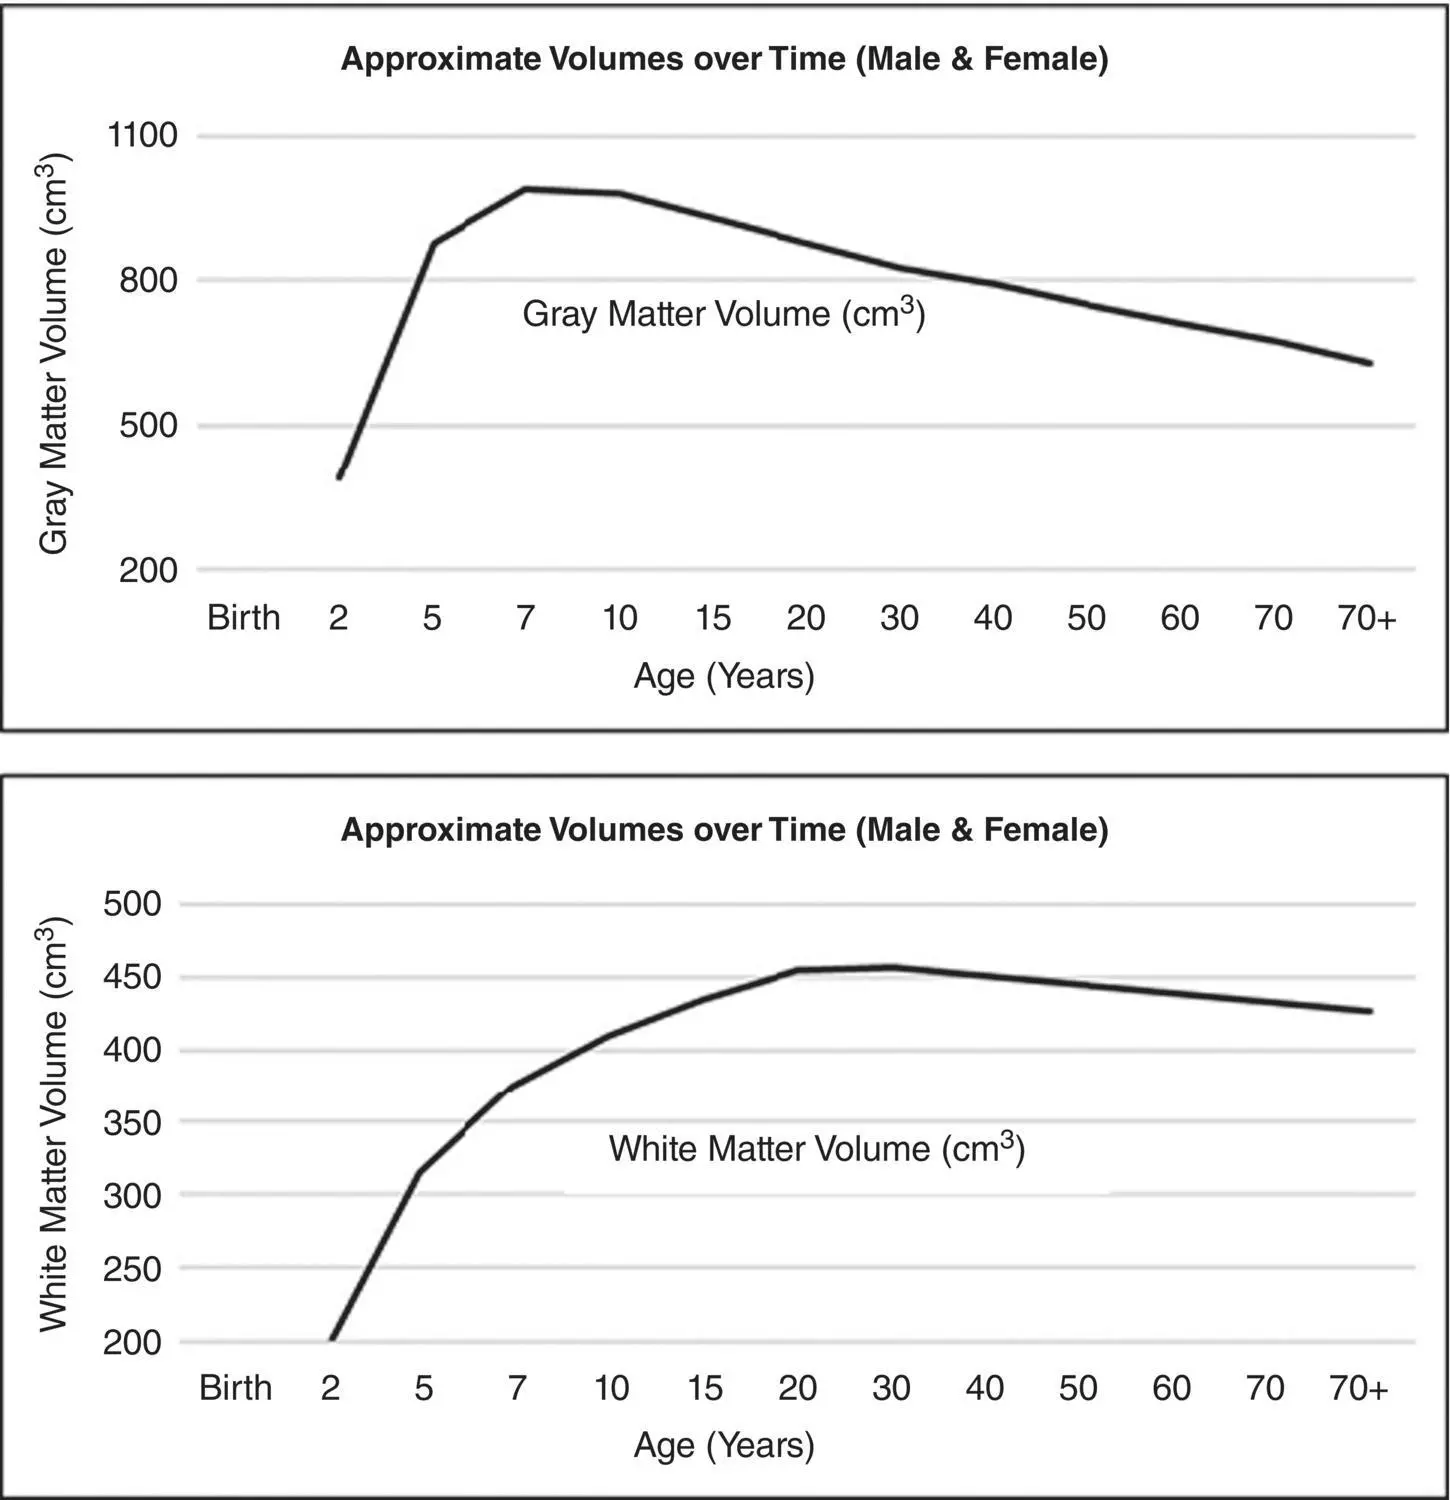
Figure 3.3 Schematic illustrations depicting brain gray and white matter changes with maturation. Brain gray matter volume increases at an accelerated rate from birth to around age 8, seems to peak for several years and then because of the pruning process gradually reduces over puberty, with continued decline related to age‐mediated cellular apoptosis. In contrast, brain white matter volume displays increase from infancy throughout early adulthood.
(The graphs are based on a compilation of information extracted and adapted from Courchesne et al., 2000 and Pfferebaum et al., 1994.)
While actual images of the brain are elegantly shown in Figures 3.2and 3.4, and various growth plots presented in Figure 3.3, what are the limits of what can be visualized? This is critical in understanding how neuroimaging studies contribute to social brain development, because despite how impressive an image of the brain may be, brain images only portray macroscopic development. What is represented in one cubic millimeter of an MR or CT image, has been described by Insel and Landis (2013, p. 565) as follows: “Imaging with the highest spatial resolution, currently a voxel of about 1‐cubic mm isotropic, has been estimated to contain 80,000 neurons and 4.5 million synapses.” Since there are 2–3, and in some regions, 10 times the number of glial cells per neuron, the total number of neural cells (neurons + glial cells) can be in the hundreds of thousands just within a single cubic millimeter of a scan image. Micheva et al. (2020, p. 253) provide additional insight as to this micro environment: “Brains can be viewed as vast ensembles of highly diverse and dynamic synapses that shape and store information as it travels through the networks of neurons that generate and interconnect those synapses. There are more than 100 trillion synapses per human neocortex, and each synapse is itself a highly complex entity, comprising thousands of diverse and cooperative signal‐transduction proteins.” In a rodent histological study, Motta et al. (2019) demonstrated that within a 10 cubic micron sample of mouse cortical tissue, 34,221 axons could be histologically identified and counted. Accordingly, as the reader reviews neuroimaging statements in this chapter, only inferences about the cellular level of function can be made. As such, even a subtle neuroimaging finding may have major implications depending on the ROI.
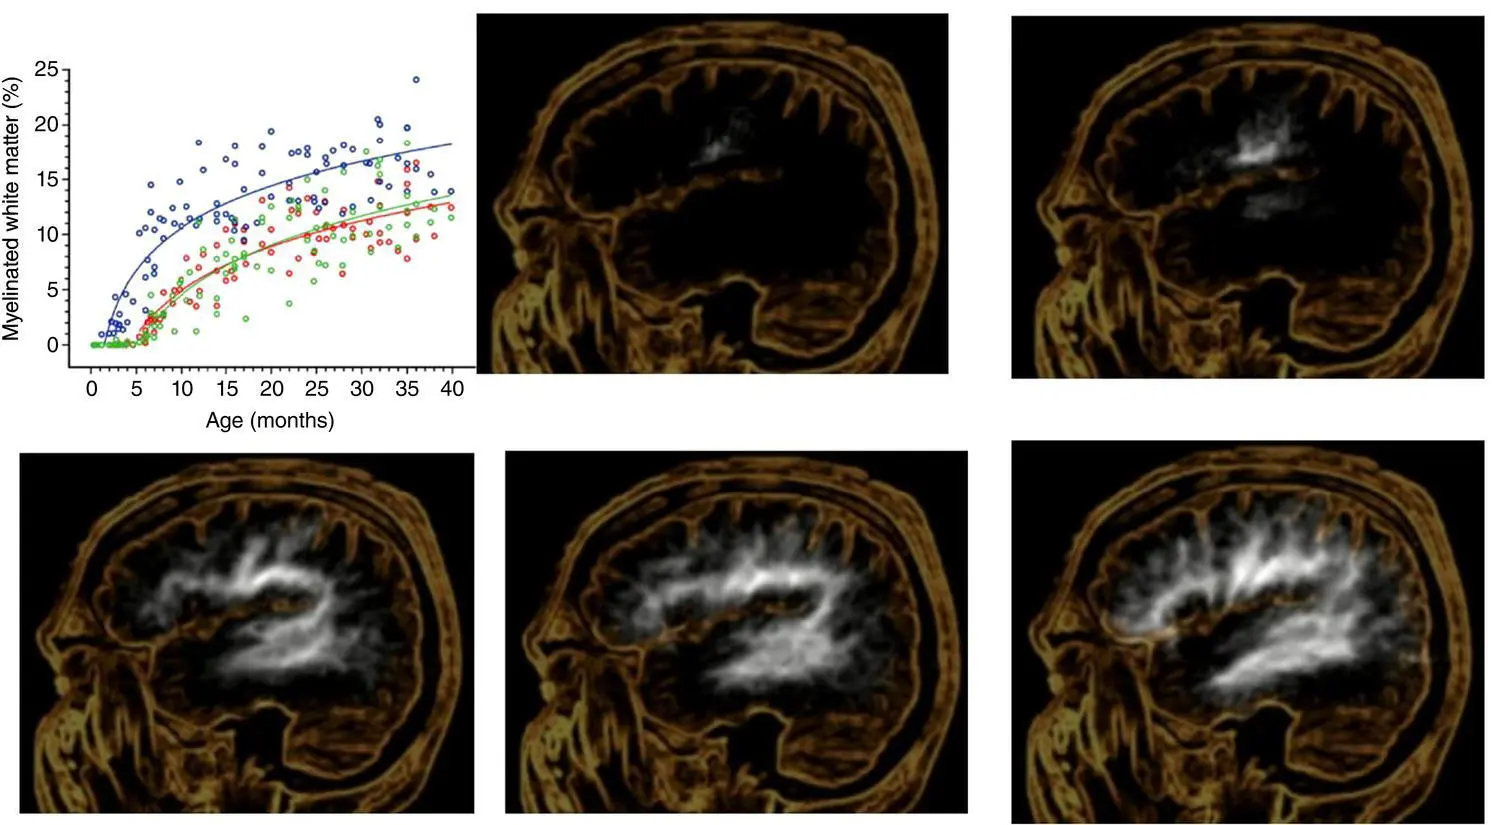
Figure 3.4 White matter maturation from birth through 36 months of age
(Reproduced with permission from Pujol et al., 2006). Reproduced with permission from Wolters Kluwer.
Social Brain Networks Determined from Lesion Analysis Studies
The earliest human neuropsychological studies that focused on social behavior and brain function, all prior to the advent of contemporary neuroimaging, began mostly with adults (see Bigler, 2017). This era also included surgical treatment in the form of frontal lobotomies for neuropsychiatric disorder (Ackerly, 1950), where there could be pre‐ and postsurgical studies of a patient’s social behavior. Throughout the 20th century there were extensive animal investigations that developed experimental models of animal social behavior and studied the effects of brain lesions (Grossman, 1967). As neurosurgical treatment for traumatic brain injury (TBI) improved and survival rates increased, over the mid‐part of the 20th century, changes in social behavior following TBI also contributed significantly to the literature about social brain development (Bigler et al., 2013). It was from these studies that the consensus arose for the importance of frontal and temporal lobe regions of the brain along with the limbic system as key players in regulating social behavior, including how these brain regions modulate social anxiety in children at risk for temperamental dyscontrol (Auday & Pérez‐Edgar, 2019).
Читать дальшеИнтервал:
Закладка:
Похожие книги на «The Wiley-Blackwell Handbook of Childhood Social Development»
Представляем Вашему вниманию похожие книги на «The Wiley-Blackwell Handbook of Childhood Social Development» списком для выбора. Мы отобрали схожую по названию и смыслу литературу в надежде предоставить читателям больше вариантов отыскать новые, интересные, ещё непрочитанные произведения.


Обсуждение, отзывы о книге «The Wiley-Blackwell Handbook of Childhood Social Development» и просто собственные мнения читателей. Оставьте ваши комментарии, напишите, что Вы думаете о произведении, его смысле или главных героях. Укажите что конкретно понравилось, а что нет, и почему Вы так считаете.