Mohammed Meah - Essential Statistics for Bioscientists
Здесь есть возможность читать онлайн «Mohammed Meah - Essential Statistics for Bioscientists» — ознакомительный отрывок электронной книги совершенно бесплатно, а после прочтения отрывка купить полную версию. В некоторых случаях можно слушать аудио, скачать через торрент в формате fb2 и присутствует краткое содержание. Жанр: unrecognised, на английском языке. Описание произведения, (предисловие) а так же отзывы посетителей доступны на портале библиотеки ЛибКат.
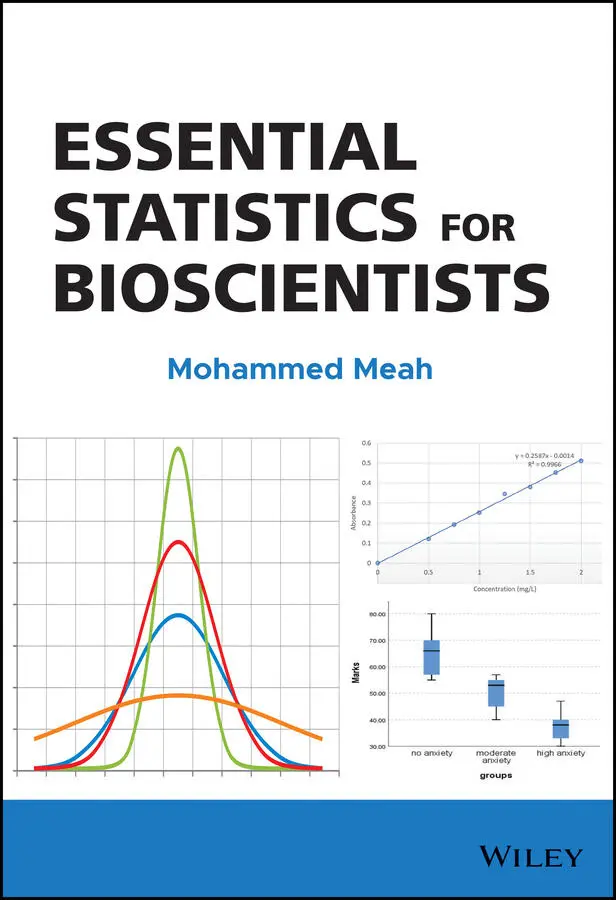
- Название:Essential Statistics for Bioscientists
- Автор:
- Жанр:
- Год:неизвестен
- ISBN:нет данных
- Рейтинг книги:5 / 5. Голосов: 1
-
Избранное:Добавить в избранное
- Отзывы:
-
Ваша оценка:
Essential Statistics for Bioscientists: краткое содержание, описание и аннотация
Предлагаем к чтению аннотацию, описание, краткое содержание или предисловие (зависит от того, что написал сам автор книги «Essential Statistics for Bioscientists»). Если вы не нашли необходимую информацию о книге — напишите в комментариях, мы постараемся отыскать её.
, experienced university and bioscientist Dr Mohammed Meah delivers easy access to statistical analysis and data presentation. It is a great resource for students in the field of life and health sciences to conceptualize, analyze, and present data. This book uses three popular and commonly used statistics softwares—Microsoft Excel, Graphpad Prism, and SPSS—and offers clear, step-by-step instructions for essential data analysis and graphical/tabular display of data.
Beginning with fundamental statistics terminology and concepts, including data types, descriptive statistics (central and spread of data), exploratory statistics (graphical display) and inferential statistics (hypothesis testing and correlation), the content gradually builds in complexity, explaining which statistical test is best suited and how to perform it.
A thorough introduction to basic statistical terms and building up to an advanced level of statistical application- ideal for those new to study of statistics Extensive application of three popular software packages- Microsoft Excel, Graphpad Prism and SPSS Numerous hands-on examples of performing data analysis using Microsoft Excel, Graphpad Prism, and SPSS Considers the limitations and errors of statistical analysis Essential reading for those designing and planning a research project in Biosciences Perfect for undergraduate students in the life and health sciences,
will also earn a place in the libraries of anyone studying medicine, nursing, physiotherapy, pharmacy, and dentistry requiring a refresher or primer on statistical fundamentals.
Essential Statistics for Bioscientists — читать онлайн ознакомительный отрывок
Ниже представлен текст книги, разбитый по страницам. Система сохранения места последней прочитанной страницы, позволяет с удобством читать онлайн бесплатно книгу «Essential Statistics for Bioscientists», без необходимости каждый раз заново искать на чём Вы остановились. Поставьте закладку, и сможете в любой момент перейти на страницу, на которой закончили чтение.
Интервал:
Закладка:
Guide
1 Cover
2 Title page
3 Copyright
4 Table of Contents
5 ACKNOWLEDGEMENTS
6 LIST OF WORKED EXAMPLES OF STATISTICAL TESTS
7 Begin Reading
8 Appendix 1 Historical Landmarks in Statistics
9 Appendix 2 Common Statistical Terms
10 Appendix 3 Common Symbols Used in Statistics
11 Appendix 4 Standard Formulas
12 Appendix 5 How to Calculate Sample Size
13 Appendix 6 Familiarisation with GraphPad Prism
14 Appendix 7 Answers to Sample Problems
15 Appendix 8 Standard Critical Tables
16 REFERENCES
17 INDEX
18 End User License Agreement
Pages
1 i
2 ii
3 iii
4 iv
5 v
6 vi
7 vii
8 viii
9 ix
10 x
11 1
12 2
13 3
14 4
15 5
16 6
17 7
18 8
19 9
20 10
21 11
22 12
23 13
24 14
25 15
26 16
27 17
28 18
29 19
30 20
31 21
32 22
33 23
34 24
35 25
36 26
37 27
38 28
39 29
40 30
41 31
42 32
43 33
44 34
45 35
46 36
47 37
48 38
49 39
50 40
51 41
52 42
53 43
54 44
55 45
56 46
57 47
58 48
59 49
60 50
61 51
62 52
63 53
64 54
65 55
66 56
67 57
68 58
69 59
70 60
71 61
72 62
73 63
74 64
75 65
76 66
77 67
78 68
79 69
80 70
81 71
82 72
83 73
84 74
85 75
86 76
87 77
88 78
89 79
90 80
91 81
92 82
93 83
94 84
95 85
96 86
97 87
98 88
99 89
100 90
101 91
102 92
103 93
104 94
105 95
106 96
107 97
108 98
109 99
110 100
111 101
112 102
113 103
114 104
115 105
116 106
117 107
118 108
119 109
120 110
121 111
122 112
123 113
124 114
125 115
126 116
127 117
128 118
129 119
130 120
131 121
132 122
133 123
134 124
135 125
136 126
137 127
138 128
139 129
140 130
141 131
142 132
143 133
144 134
145 135
146 136
147 137
148 138
149 139
150 140
151 141
152 142
153 143
154 144
155 145
156 146
157 147
158 148
159 149
160 150
161 151
162 152
163 153
164 154
165 155
166 156
167 157
168 158
169 159
170 160
171 161
172 162
173 163
174 164
175 165
176 166
177 167
178 168
179 169
180 170
181 171
182 172
183 173
184 174
185 175
186 176
187 177
188 178
189 179
190 180
191 181
192 182
193 183
194 184
195 185
196 186
197 187
198 188
199 189
200 190
201 191
202 192
203 193
204 194
205 195
206 196
207 197
208 198
209 199
210 200
211 201
212 202
213 203
214 204
215 205
216 206
217 207
218 208
219 209
220 210
221 211
222 212
223 213
224 214
225 215
226 216
227 217
228 218
229 219
230 220
231 221
232 222
233 223
234 224
235 225
236 226
237 227
238 228
239 229
240 230
241 231
242 232
243 233
244 234
245 235
246 236
247 237
248 238
249 239
250 240
251 241
252 242
253 243
254 244
255 245
256 246
Acknowledgements
I would like to thank my daughters (Maryam and Zaynah) for their constant encouragement and support during the writing of this book. I would like to thank the many project students over the years whose research project ideas have challenged me to delve into statistics. I have to say a special thank you to my mother (BR Chowdhury) and father (MM Chowdhury) for always being positive and supportive. Many thanks to my colleagues (Rane and Elizabeth) for their insightful comments and suggestions.
Lastly, I would like to thank Wiley Publishers for their encouragement and above all patience and understanding in the completion of this book.
“If it’s green or wriggles, it’s biology. If it stinks, it’s chemistry. If it doesn’t work, it’s physics or engineering. If it’s green and wiggles and stinks and still doesn’t work, it’s psychology. If it’s incomprehensible, it’s mathematics. If it puts you to sleep, it’s statistics.”
— Anonymous
Introduction
“All life is an experiment. The more experiments you make, the better.”
Ralph Waldo Emerson (1803–1882) - American lecturer, philosopher and poet
The word statistics is derived from the Latin word ‘status’ – meaning political state or a government. Statistics deals with collection, organization, presentation, analysis and interpretation of data to obtain meaningful and useful information. Statistics can be split into two major areas, namely, descriptive and inferential. Descriptive statistics involves collecting, summarizing, and presenting data. Inferential statistics involves analysing sample data to draw conclusions about a population.
Statistics is an area which is often much reduced in the curriculum of undergraduate bioscience degree courses. Statistics tends to be linked to research modules. Lecturers often assume that students have a strong grasp of mathematical and statistical concepts including data analysis. However, the reality is that most students are ‘rusty’ in these areas, particularly in statistics. The most urgent need for statistics is usually for the research project which is typically in the final year of the undergraduate degree (level 6). It is unclear, during undergraduate studies, how much and when statistics should be taught. In addition, there are a variety of software packages which can be used to perform statistical analysis, and display data, not all of which can be accessed or used competently by the students. Indeed, it would be fair to say that existing software can produce extensive statistical analysis, but choosing an appropriate test and interpreting the data analysis can be challenging. It is rare to have the luxury to be able to consult a resident statistician in the Bioscience Department.
There are a variety of statistical software packages, which vary in the difficulty of use, and in what tests they can perform. An additional bonus is the ability to plot graphically, mean and individual data. The most popular software packages used currently to perform statistics and present data in graphical form are Excel (Microsoft), Prism (GraphPad) and SPSS (IBM). Microsoft Excel is a popular spreadsheet software package which is easily available, easy to use for data analysis (although types of analysis are limited), and useful to plot data graphically (limited in detail of graph). Prism is good for statistical analysis but excellent for plotting data (graphs produced are of professional standard). SPSS is the most complex, but most comprehensive statistical package. It allows a very detailed analysis of data using a wide range of tests. However, it is weak in interpreting the statistical analysis and the level of detail in plotting graphs.
A core module that most students would do is a research project. This requires them to put forward a research proposal, in which they design experiments and formulate hypotheses, collect data, analyse data, and then write a research report. From my many years of supervising undergraduates and postgraduate projects, I have observed that firstly, narrowing a project down to a specific aim and secondly, applying statistical analysis to the data obtained causes the most anxiety in students.
Читать дальшеИнтервал:
Закладка:
Похожие книги на «Essential Statistics for Bioscientists»
Представляем Вашему вниманию похожие книги на «Essential Statistics for Bioscientists» списком для выбора. Мы отобрали схожую по названию и смыслу литературу в надежде предоставить читателям больше вариантов отыскать новые, интересные, ещё непрочитанные произведения.


Обсуждение, отзывы о книге «Essential Statistics for Bioscientists» и просто собственные мнения читателей. Оставьте ваши комментарии, напишите, что Вы думаете о произведении, его смысле или главных героях. Укажите что конкретно понравилось, а что нет, и почему Вы так считаете.